
Cover and narrative setup


Deck preview
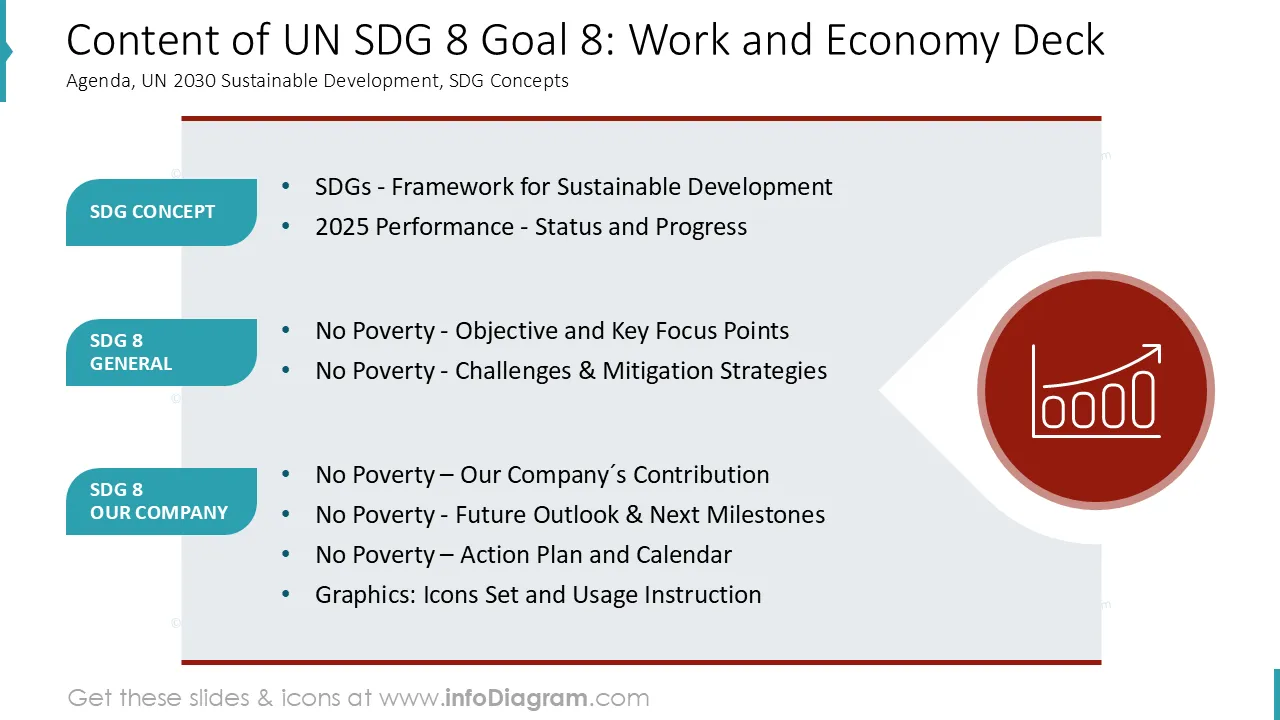
This template does not have a dedicated before/after case study, so we show the strongest slides from the actual deck instead.
Cover and narrative setup
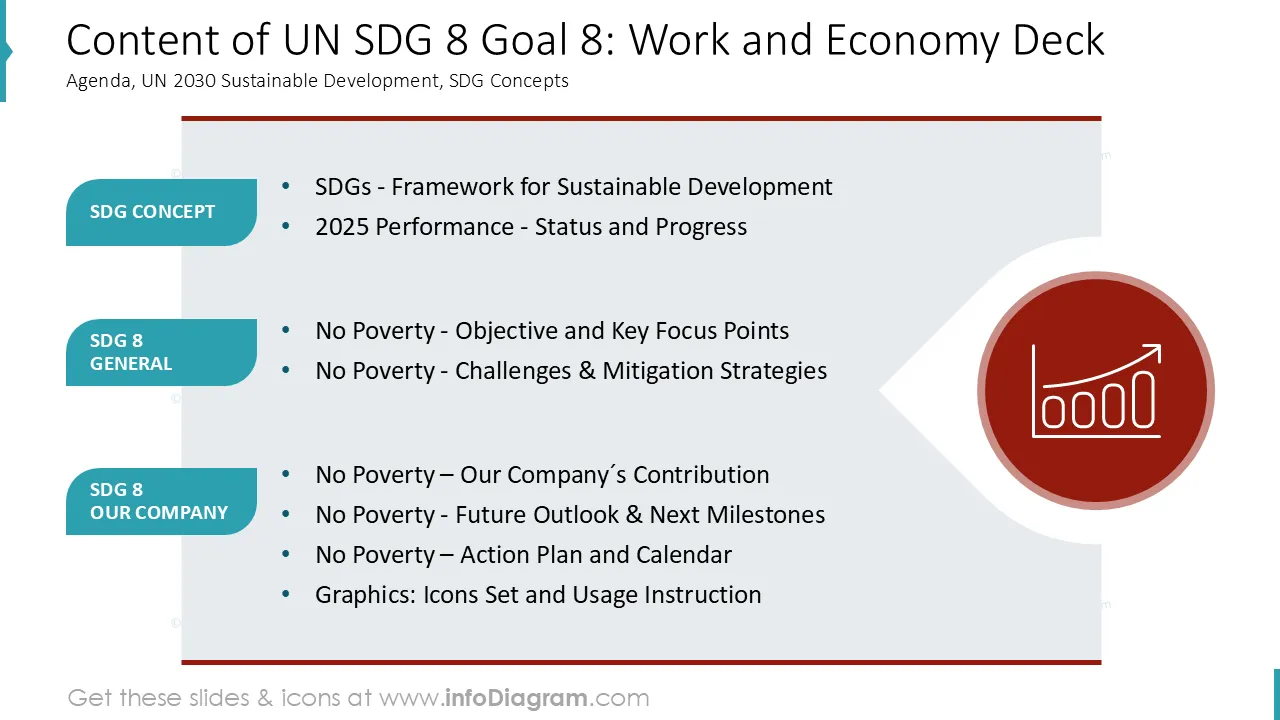
Core structure and talking points
Polished visual slide from the deck
Do you need to present your impact on employment, productivity, and economic growth?
Check our presentation template with pre-designed Sustainable Development Goals SDG 8 Work and Economic Growth slides. It helps you to show labor, growth, and performance indicators clearly and visually.
This PowerPoint slide deck is designed in a modern flat style with colorful vector illustrations and line icons. All graphic shapes can be recolored and resized without quality loss.
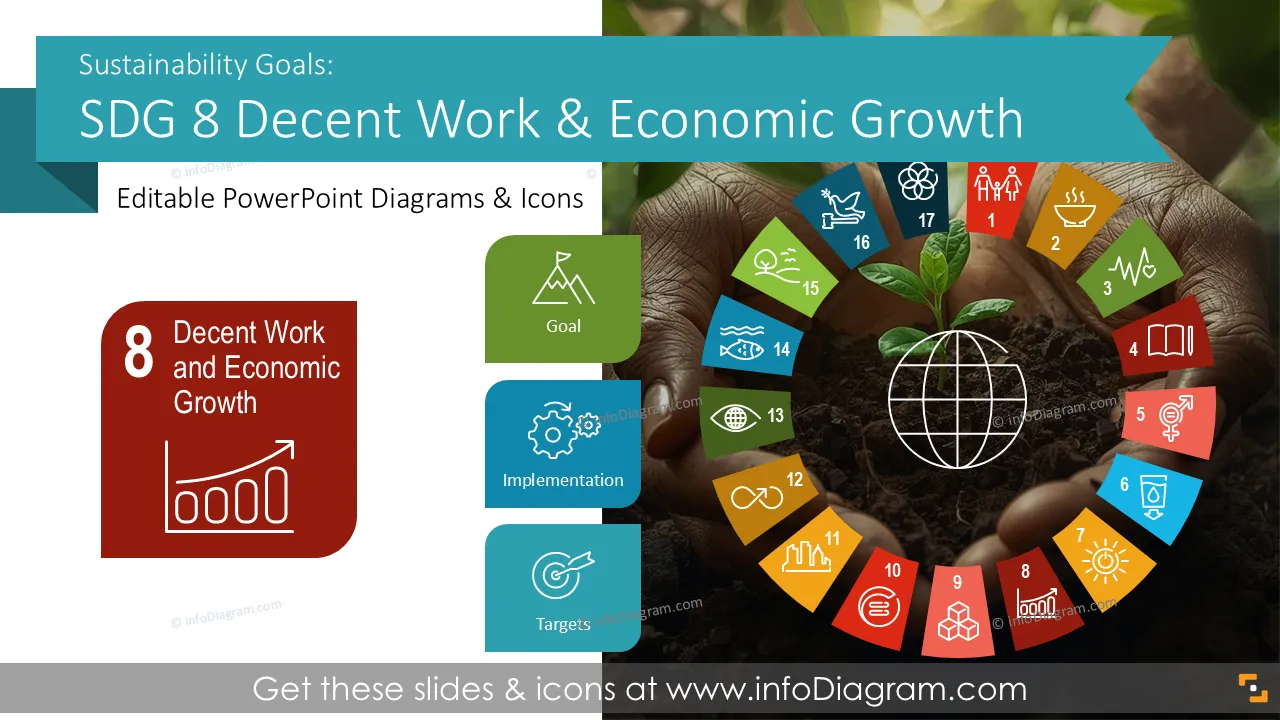
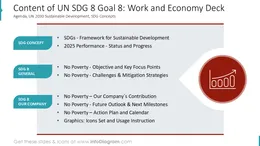
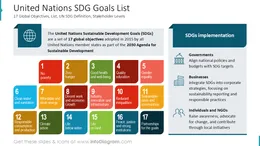
SDG 8 is a United Nations Sustainable Development Goal focused on promoting sustained, inclusive, and sustainable economic growth.
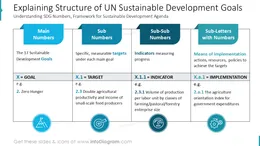
This UN goal covers activities towards ensuring decent work, employment conditions, productivity, entrepreneurship, and economic resilience. SDG 8 provides a shared framework to track labor and growth performance through defined targets and indicators.
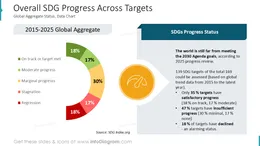
Decent work and growth of economy topics often means presenting sets of social and financial data, explanations of various economy concepts. Having visual slides with concept illustrations and attractive data visualizations help organize employment metrics, growth trends, and productivity indicators.
Using diagrams makes your SDG presentation content easier to understand. Adding icons and using structured layouts for dashboards supports clear communication of labor and growth topics. A consistent PowerPoint template keeps messaging aligned across reports and stakeholder updates.
Ready-made visuals save time and improve clarity in ESG reporting.
These pre-designed SDG 8 PowerPoint templates allow you to quickly reuse our illustrations. All shapes and texts are editable. We also included instructions on editing colors and style.
Here are several examples how you can use this SDG presentation visual aids:
All graphics are editable to modify the size, colors, and text. Additionally, you can expand the collection further with additional PPT symbols (see the Related Diagrams section).
You can easily modify all elements:

Vos graphiques ajoutent une belle touche à mes présentations et je les ai récemment utilisés pour l'une de mes réunions générales. Votre boîte à outils ajoute du professionnalisme à mes diapositives. Au lieu d'utiliser des cliparts standards.
Claude Jones, Directeur de l'ingénierie, @Walmartlabs, USA
J'avais besoin d'un nouveau regard sur certaines de mes diapositives. J'ai essayé de trouver un moyen de créer un effet de pinceau, de souligner, d'accentuer, d'ajouter de la couleur et les marqueurs manuscrits étaient exactement ce qu'il fallait. Très facile à utiliser, facile à ajuster la taille, à changer la couleur. C'était une solution abordable et parfaite et je suis heureux de la recommander.
Anonymous, US
L'aspect net et épuré des graphiques, et le fait qu'il m'ait permis d'éditer et de changer facilement les couleurs pour les adapter au modèle, ont été les principales raisons de mon achat.
Brandie Jenkins, Développeur E-learning, USA



You may also need