Your graphics add a nice touch to my presentations and I recently used them for one of my all-hands meetings. Your toolbox adds professionalism to my slides. Instead of using standard clipart.
Claude Jones, Director of Engineer, @Walmartlabs, USA
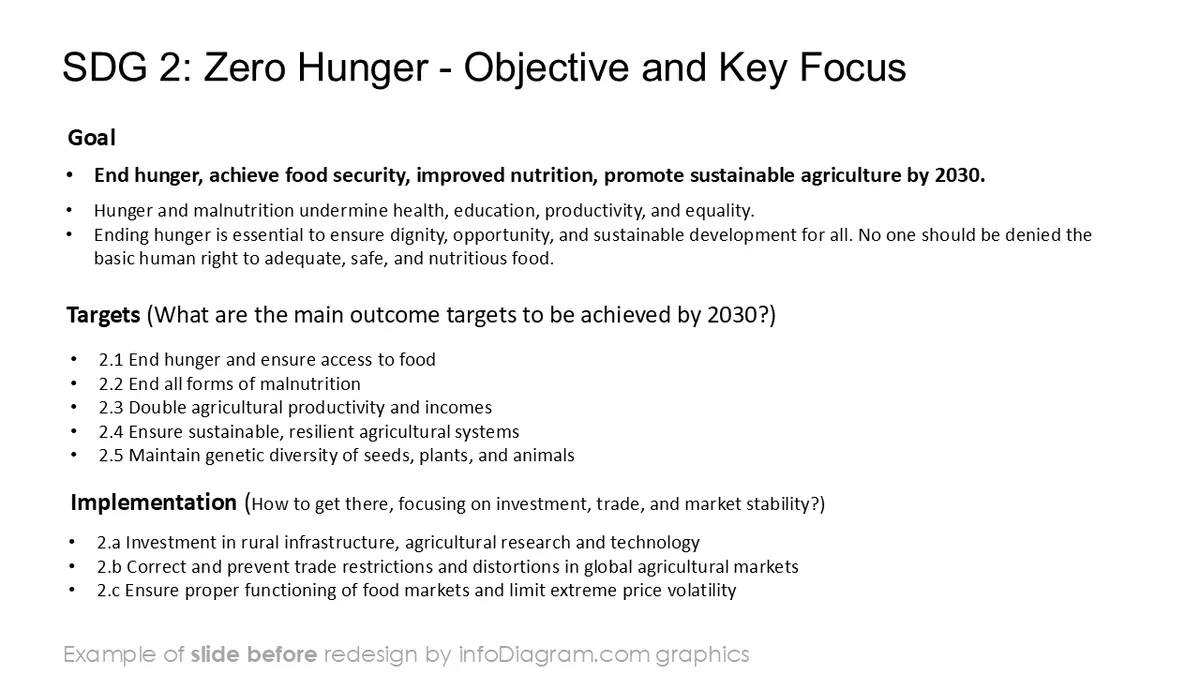
Before and after

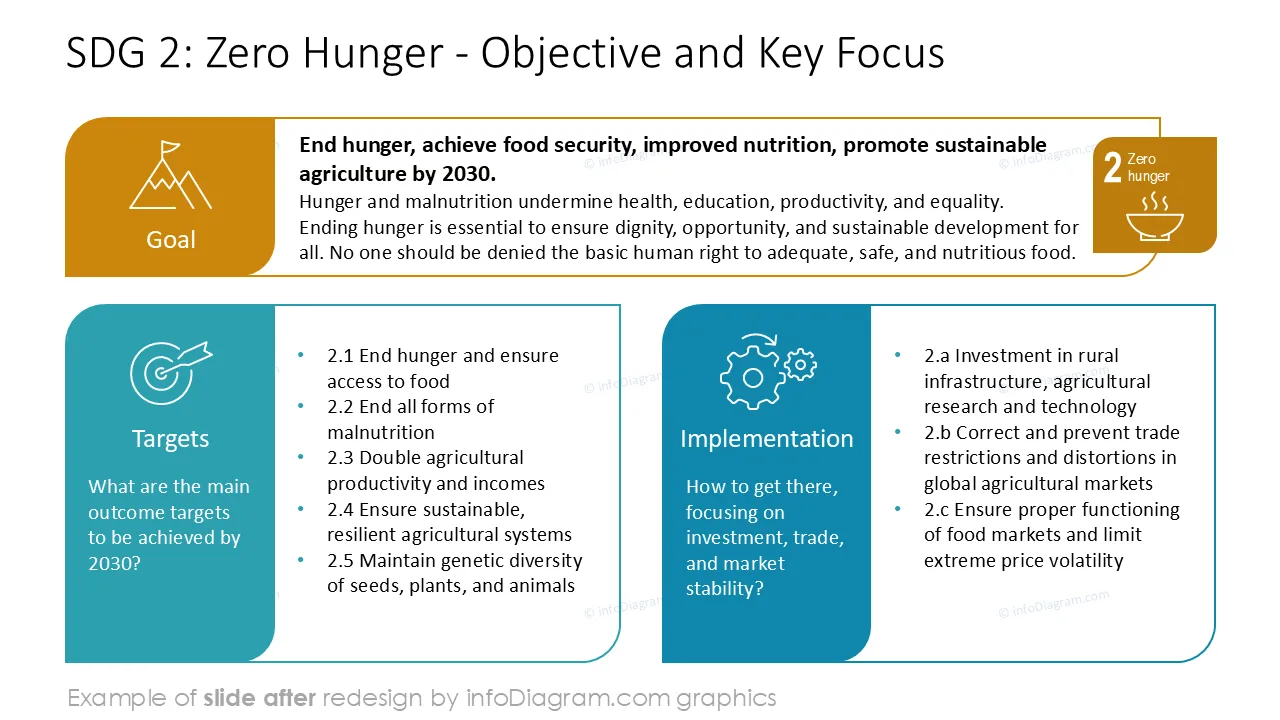
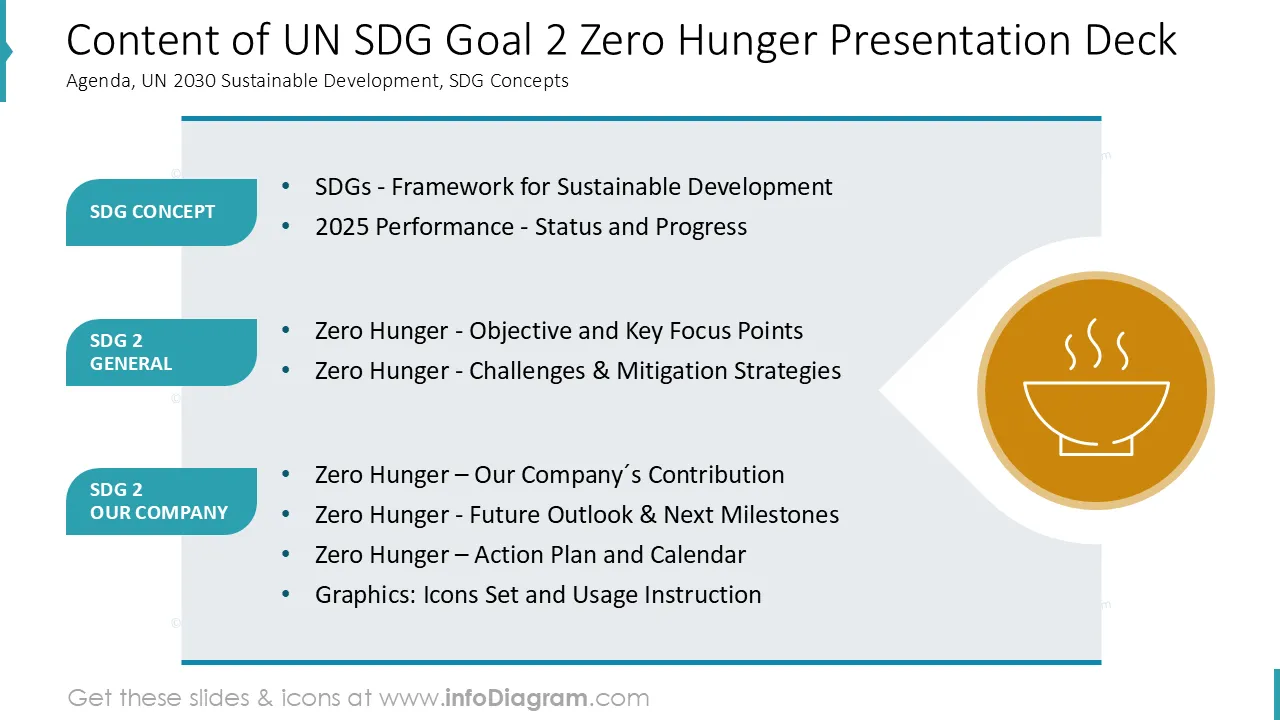
Do you want to explain your Sustainable Development Goal 2 - Zero Hunger? Use our pre-designed SDG 2 presentation that presents target Zero Hunger elements visually.
This PowerPoint slide deck is designed in an elegant, flat style with colorful vector illustrations and outline icons. All graphic shapes can be recolored and resized without quality loss.
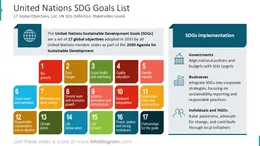
SDG 2 – Zero Hunger is one of the 17 UN Sustainable Development Goals designed as a global framework for sustainable development.
Its objective is to end hunger, achieve food security, improve nutrition, and promote sustainable agriculture. The goal focuses on equitable access to safe and nutritious food, resilience of food systems, and long-term sustainability of production.
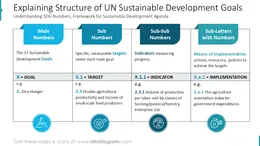
SDG 2 is a critical KPI for global development, shaping policies, investments, and cross-sector engagement for a hunger-free future.
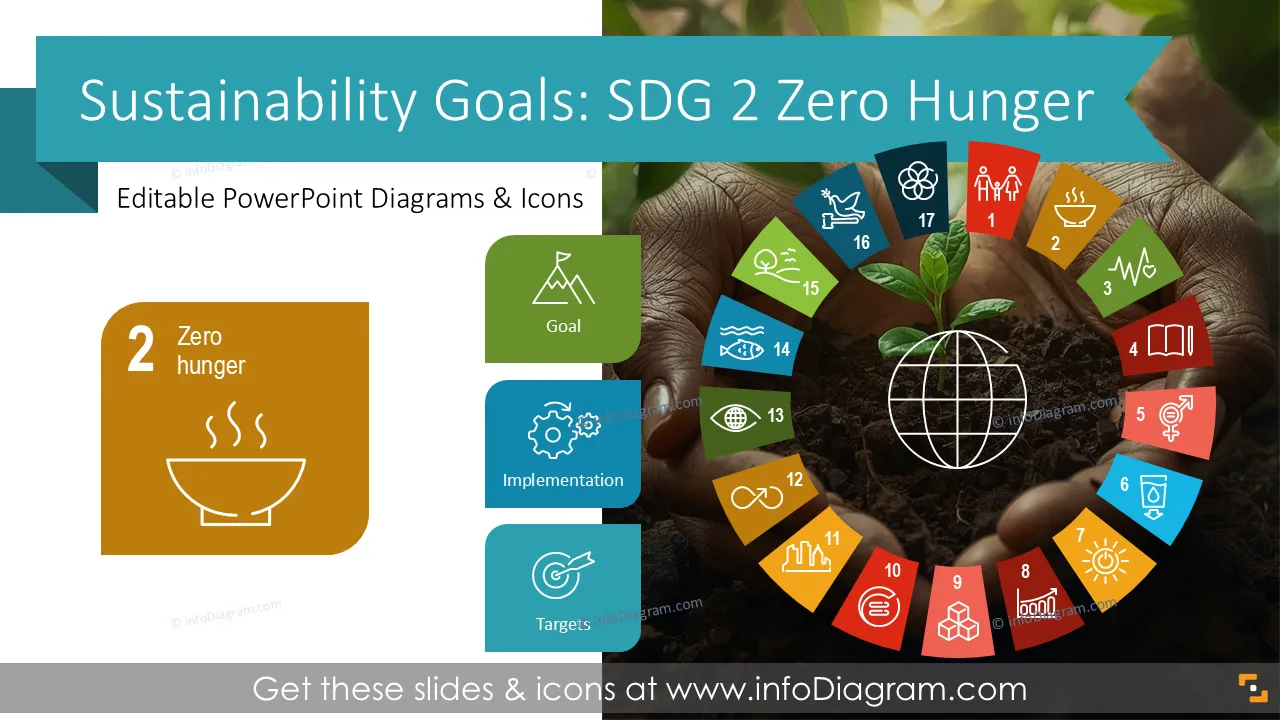
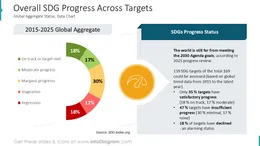
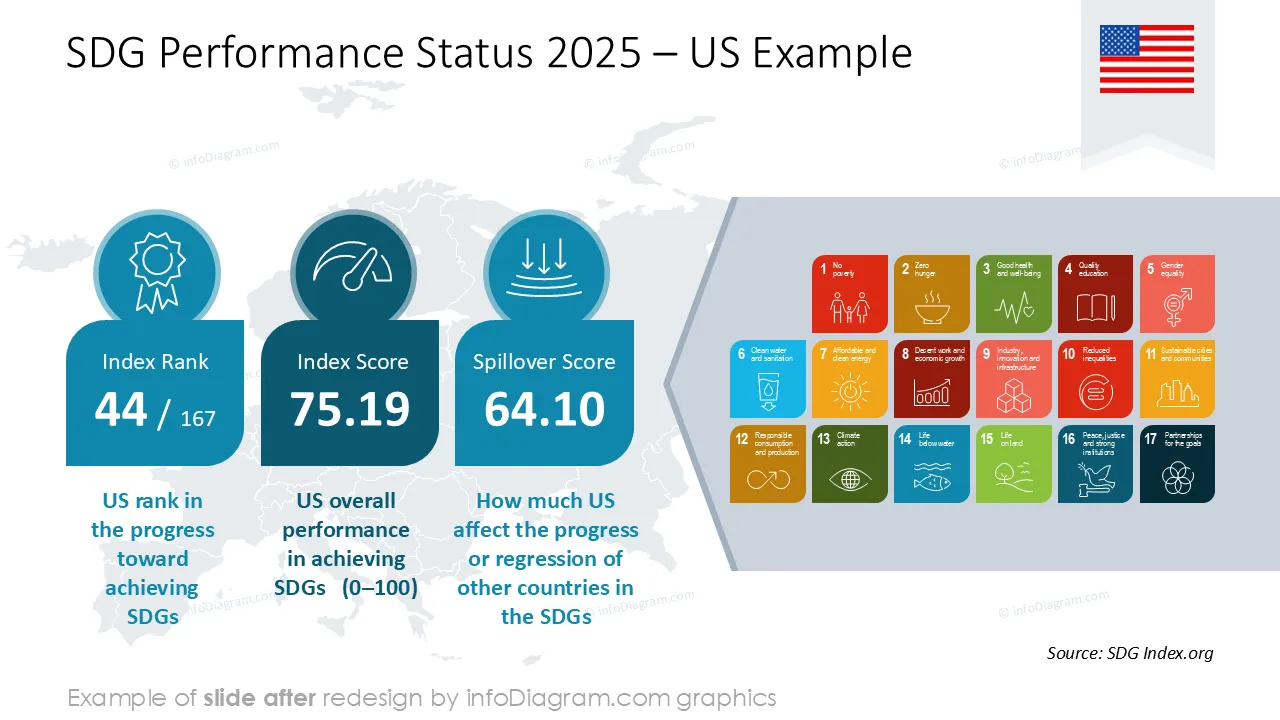
Presenting SDG 2 performance is more impactful when data and narratives are visualized clearly. Complex global indicators, progress trends, and systemic challenges are easier to understand when displayed through charts, timelines, diagrams, and icons.
Visual storytelling supports strategic communication across leadership teams, ESG offices, CSR units, NGOs, and public institutions.
A professional template helps consolidate fragmented inputs, convert them into actionable insights, and highlight achievements and gaps versus expected targets.
Diagrams can illustrate challenges and mitigation strategies, while dashboards can display Zero Hunger performance KPIs. Icons and infographics help communicate agricultural resilience, nutrition quality, food distribution logistics, and community impact in a concise way.
A well-structured visual deck improves your narrative and audience engagement
With this pre-designed deck you can reuse our illustrations and charts. Adapt them to your needs They are editable, so you can simply change the presented values. We also added an instruction on how to alter the content, values and colors.
You can use this template to communicate SDG strategy, operational execution, and progress across multiple audiences:
Try using those PowerPoint graphics to present your data visually in an elegant way.
All graphics are editable to modify the size, colors, and text. Also, you can extend the collection further with more PPT symbols (see Related Diagrams section).
Try using this set of fully editable PowerPoint vector shapes to present your data visually in an elegant way. You can easily modify all elements:
Your graphics add a nice touch to my presentations and I recently used them for one of my all-hands meetings. Your toolbox adds professionalism to my slides. Instead of using standard clipart.
Claude Jones, Director of Engineer, @Walmartlabs, USA
I needed a fresh look at some of my slides. I've tried to find a way to create a paintbrush effect, to underline, accentuate, add some color and the handwritten markers were just the things. Very easy to use, easy to size, change the color. It was an affordable, perfect solution and I'm happy to recommend it.
Anonymous, US
The crisp, clean look of the graphics, and the fact that it allowed me to easily edit and change the colors to match the template was my main reason for purchasing them.
Brandie Jenkins, E-learning Developer, USA


You may also need