

Your graphics add a nice touch to my presentations and I recently used them for one of my all-hands meetings. Your toolbox adds professionalism to my slides. Instead of using standard clipart.
Claude Jones, Director of Engineer, @Walmartlabs, USA


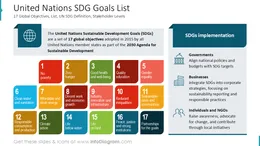
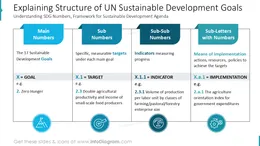
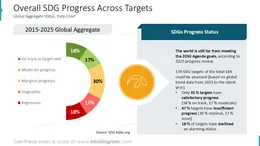
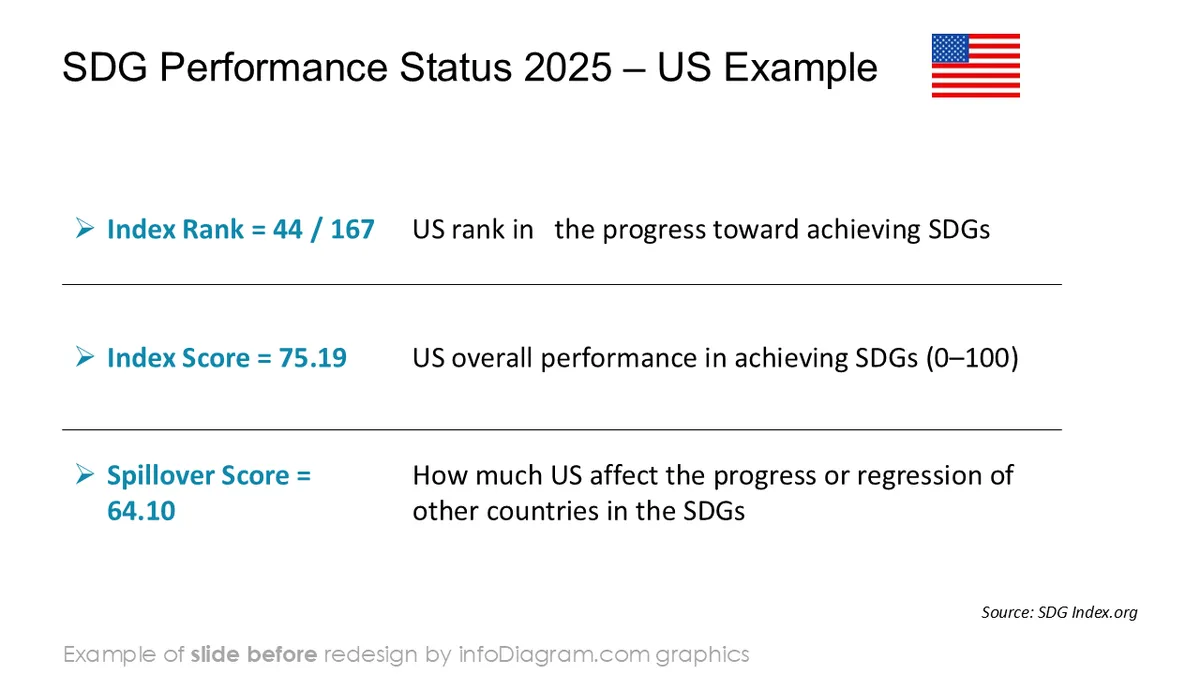
Before and after
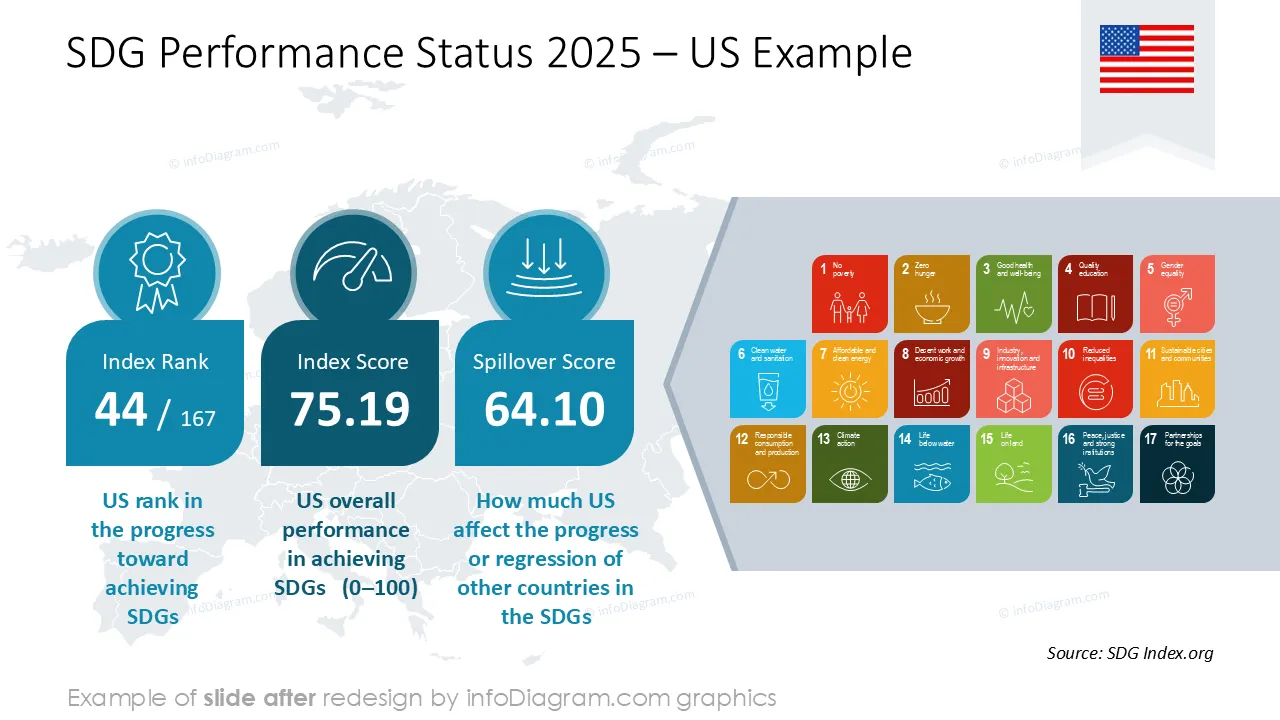
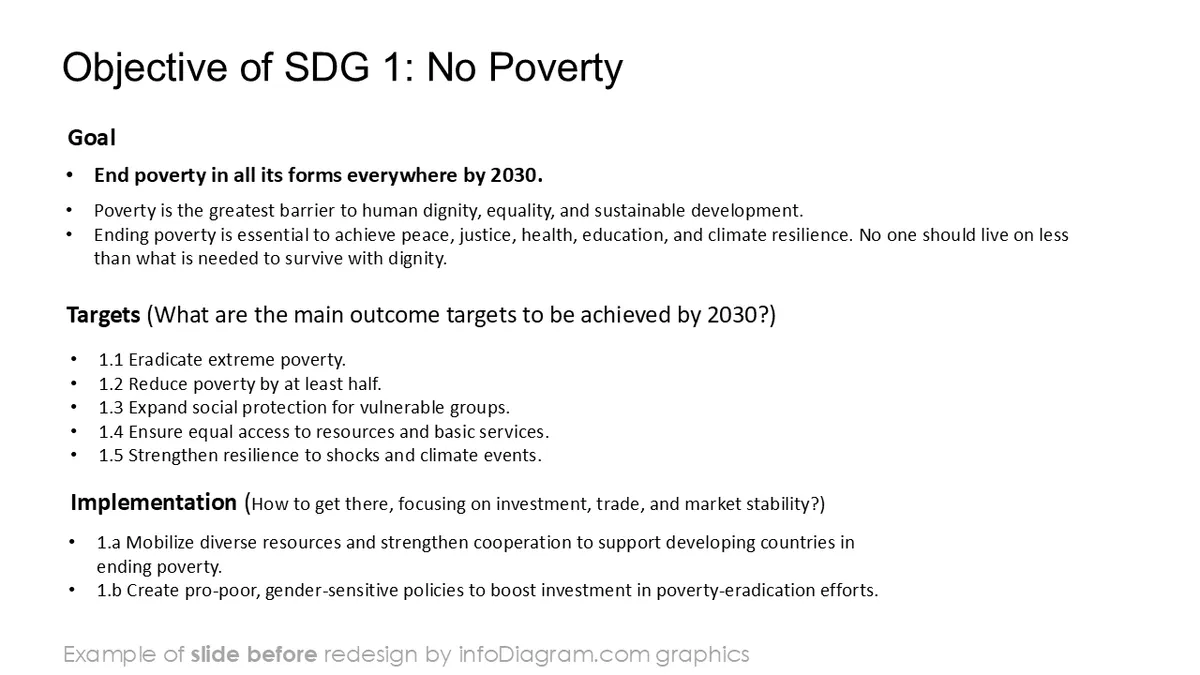
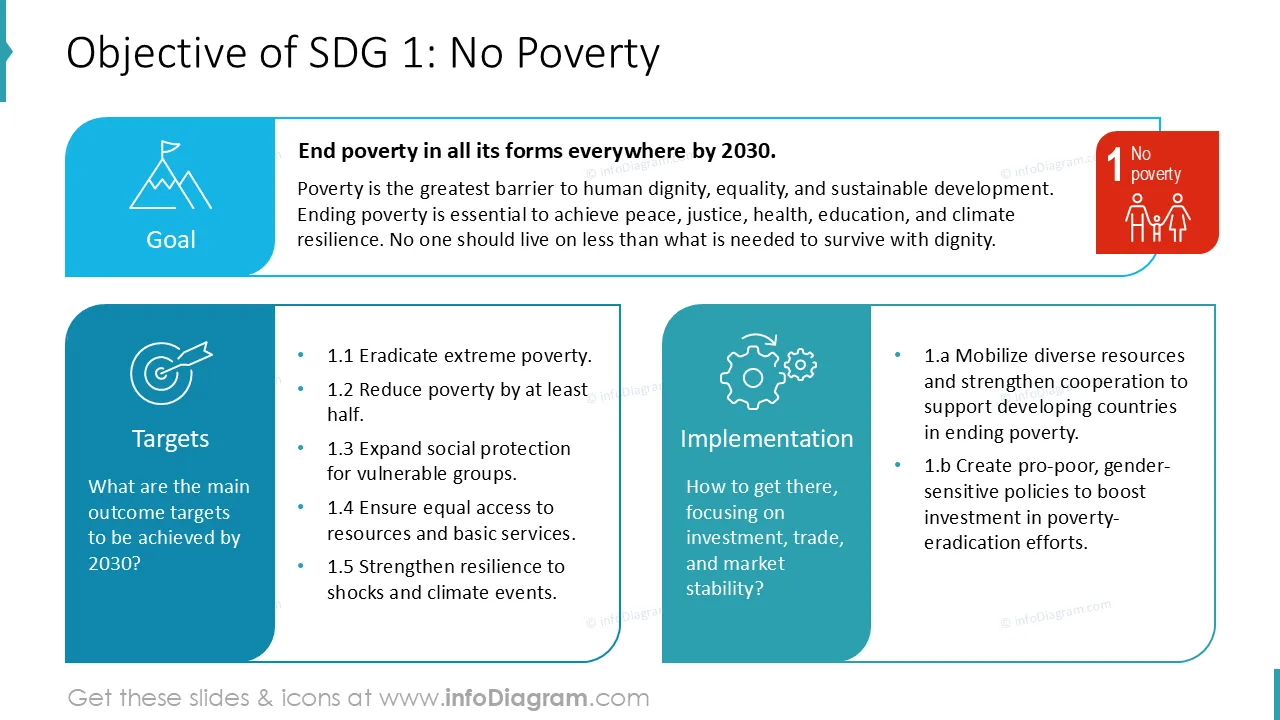
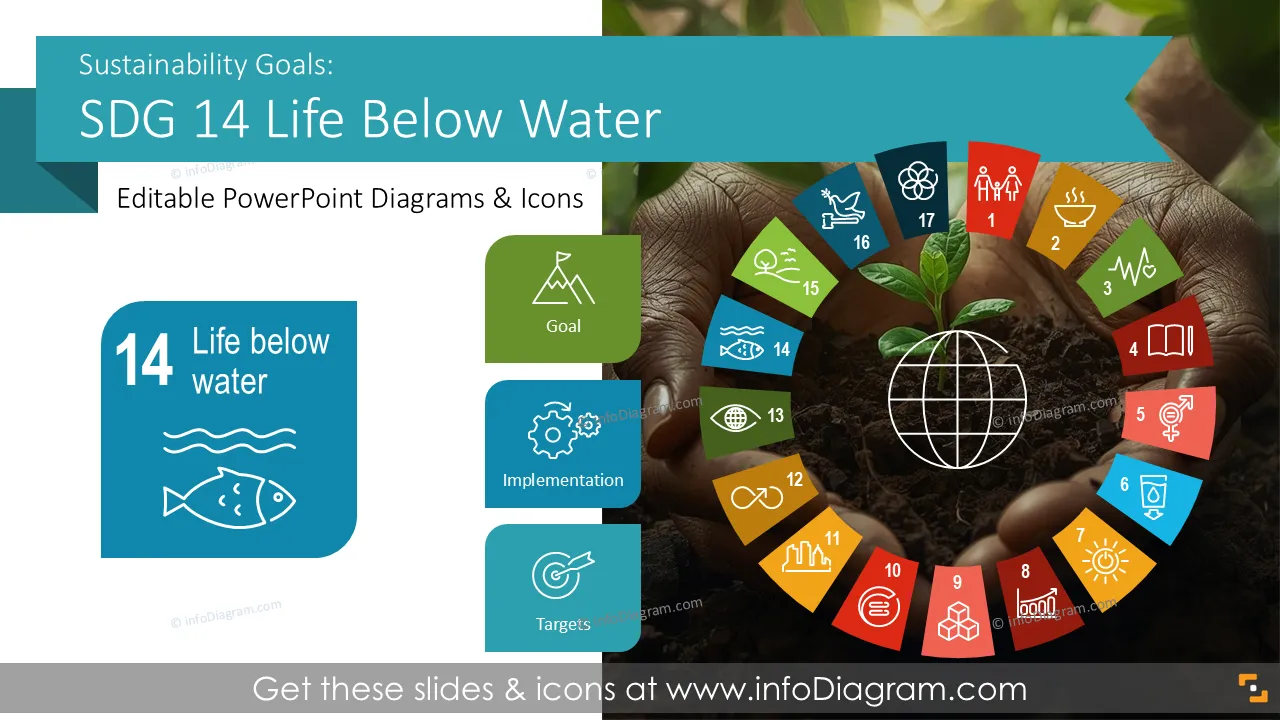
Do you need to present your impact on oceans, marine ecosystems, and sustainable use of marine resources? Use our pre-designed Sustainable Development Goals SDG 14 Life Below Water deck that incorporates ocean protection targets, indicators, and performance visuals clearly and consistently.
This PowerPoint slide deck is designed in a professional style with colorful vector illustrations and line icons. All graphic shapes can be recolored and resized without quality loss.
SDG 14 is a United Nations Sustainable Development Goal focused on conserving and sustainably using oceans, seas, and marine resources. It covers marine biodiversity, pollution reduction, sustainable fisheries, and ocean ecosystem protection.
SDG 14 provides a framework to track marine-related performance using defined targets and indicators.
Marine and ocean topics often involve scientific data and environmental indicators. Visual slides help present better complex ecosystem information and impact metrics.
For example, showing readable charts and diagrams make trends in biodiversity, pollution, and conservation easy to understand. Structured slide layouts and additional icons help you to create clear communication of ocean health topics.
Having a consistent PowerPoint template keeps your messaging professional. Ready-made visuals save time and improve clarity in environmental reporting.
See situations where you can apply this SDG presentation:
All graphics are editable to modify the size, colors, and text. Additionally, you can expand the collection further with additional PPT symbols (see the Related Diagrams section).
You can easily modify all elements:
Your graphics add a nice touch to my presentations and I recently used them for one of my all-hands meetings. Your toolbox adds professionalism to my slides. Instead of using standard clipart.
Claude Jones, Director of Engineer, @Walmartlabs, USA
I needed a fresh look at some of my slides. I've tried to find a way to create a paintbrush effect, to underline, accentuate, add some color and the handwritten markers were just the things. Very easy to use, easy to size, change the color. It was an affordable, perfect solution and I'm happy to recommend it.
Anonymous, US
The crisp, clean look of the graphics, and the fact that it allowed me to easily edit and change the colors to match the template was my main reason for purchasing them.
Brandie Jenkins, E-learning Developer, USA



You may also need