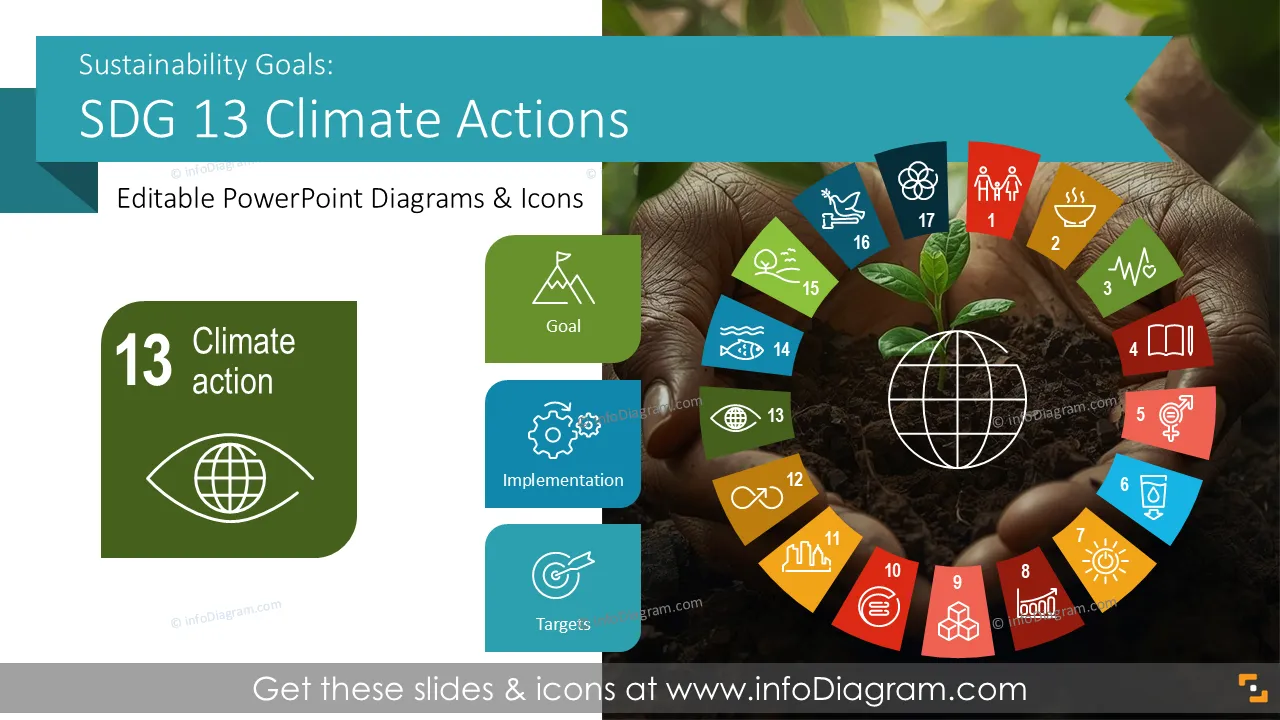
Do you need to present your actions on emissions reduction, climate risks, and transition efforts? Use our pre-designed Sustainable Development Goals SDG 13 Climate Action deck to show climate targets, indicators, and performance in professional way.
This SDG 13 PowerPoint template contains:
- 17 layouts with visual elemewnts illustrating greenhouse gas emissions, climate risks, adaptation, and mitigation measures
- 30+ icons illustrating sustainability topics, 17 SDG goals, Work, Economy, Performance, Finances, Plan, Strategy, People, Clean Energy, or other general business concepts
- Instruction on modifying those diagrams using standard PowerPoint editing tools.
This PowerPoint slide deck is designed in a professional style with colorful vector illustrations and line icons. All graphic shapes can be recolored and resized without quality loss.
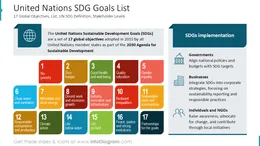
What is the UN Sustainability Goal 13 Climate Action about?
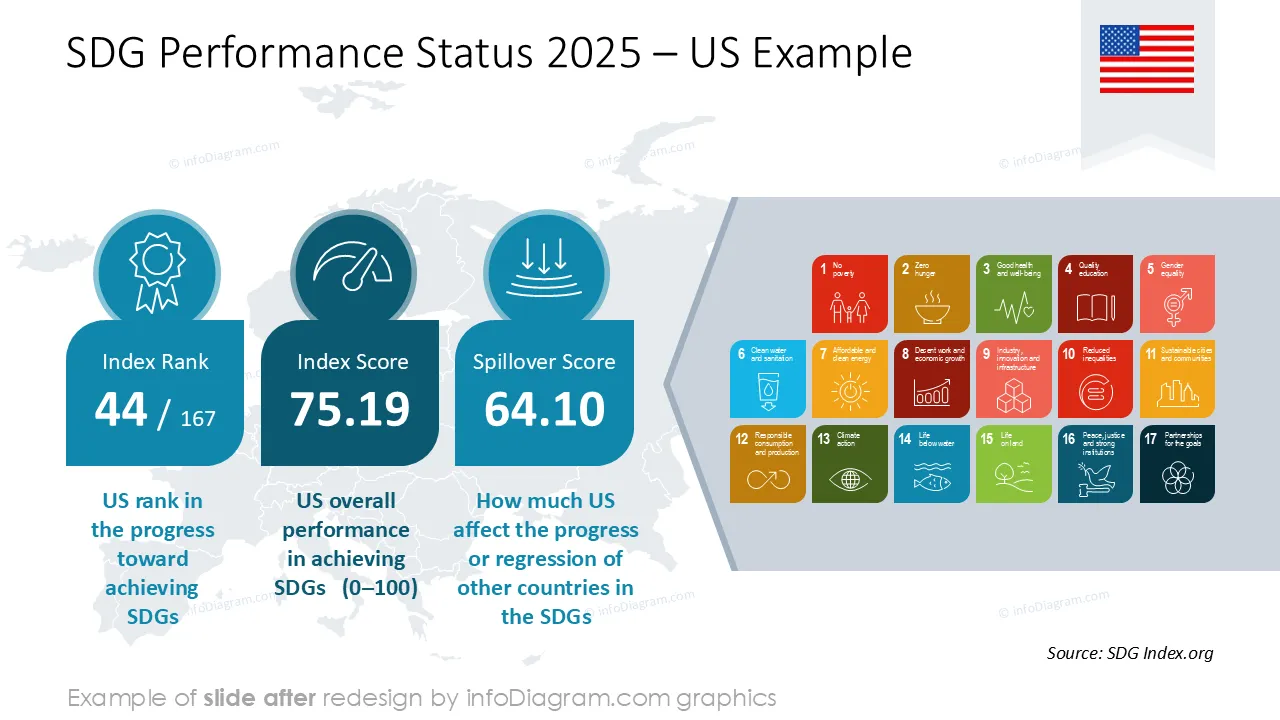
SDG 13 is a United Nations Sustainable Development Goal focused on taking urgent action to combat climate change and its impacts. It covers greenhouse gas emissions, climate risks, adaptation, and mitigation measures.
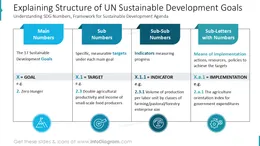
SDG 13 provides a common ground to track climate performance with defined targets and indicators.
Why use a visual way for presenting Climate Action (UN SDG 13)?
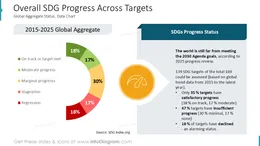
Climate topics often involve complex concepts, data, scenarios, and long-term planning. Visual slides help simplify emissions data, targets, and transition roadmaps. Using readable charts and diagrams makes those topics easier to understand. Structured presentation layouts help you clearly communicate climate actions and outcomes.
Thus, having consistent PowerPoint graphics as a source of visuals saves you time and improves clarity in your sustainability communication.
Feel free to reuse our illustrations and adapt them to your needs. All shapes and texts are editable. We also included instructions on editing colors and style.
Where can you use the SDG 13 Climate Action PPT template?
A few examples where you can use this SDG presentation template:
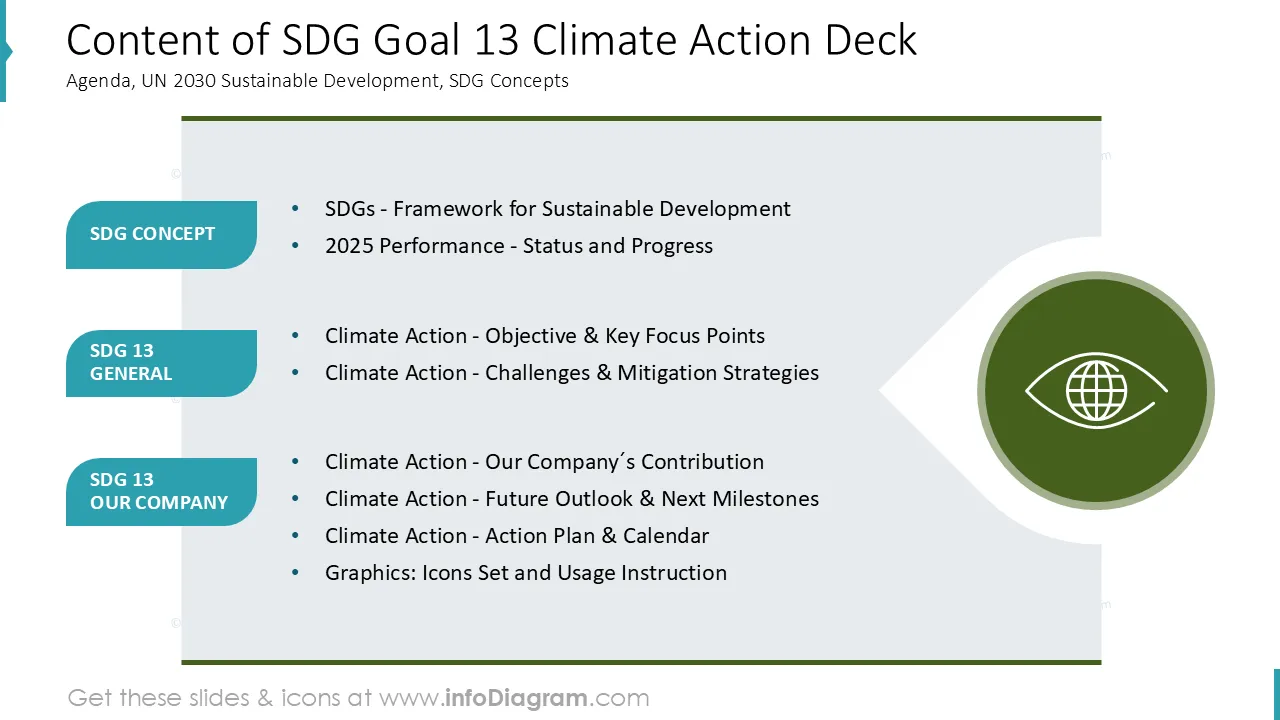
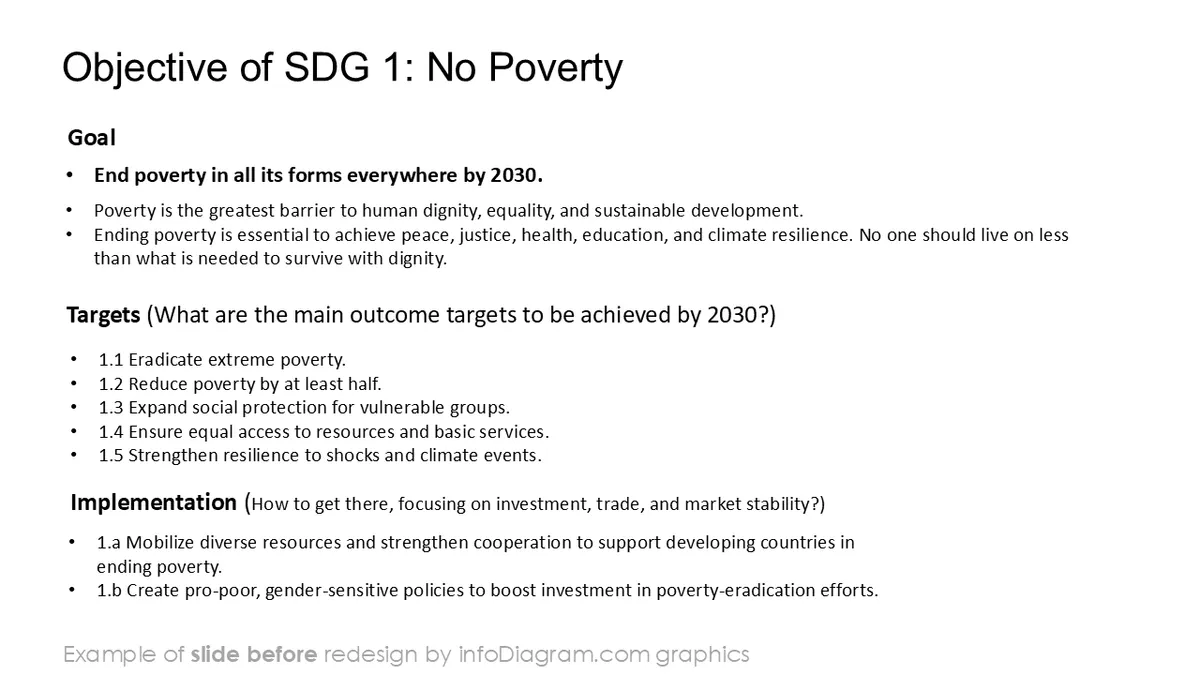
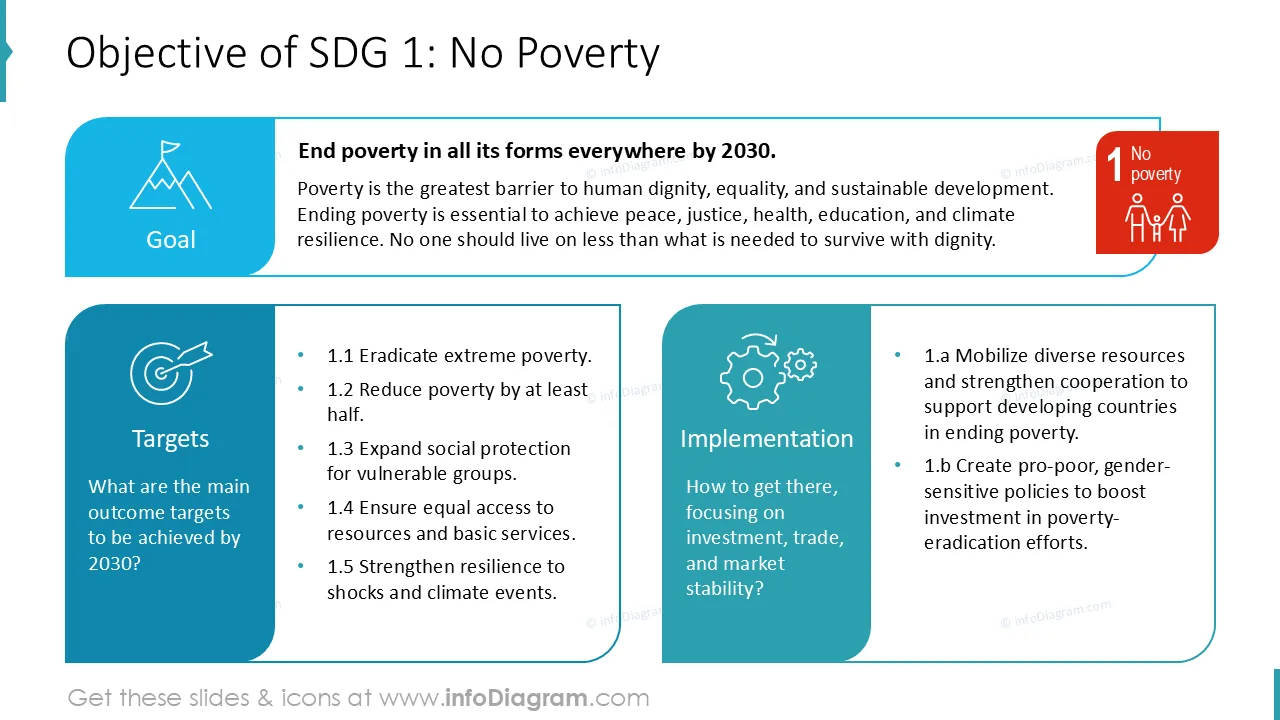
- Explain SDG 13 goals, targets, and indicators in a concise overview. Copy our definition slide to your presentation template, adapt it’s look and explanations length to your context
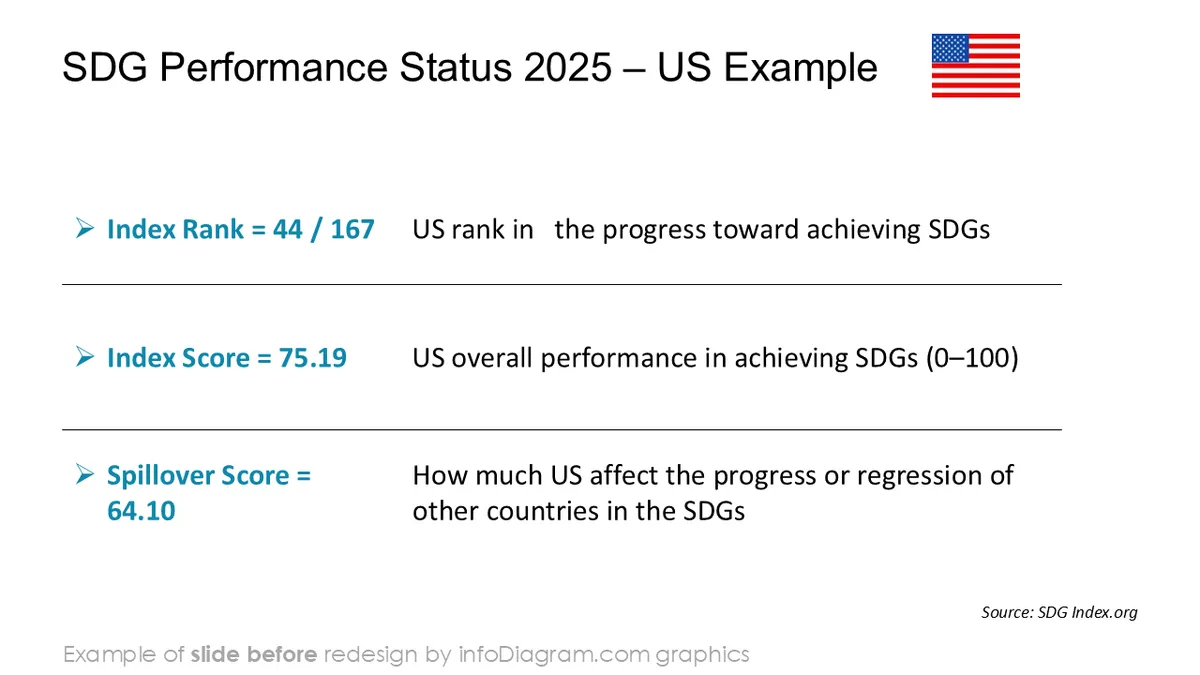
- Present KPIs related to emissions, climate risk, and mitigation using tables and dashboards from our template
- Present decarbonization, adaptation, and resilience initiatives
- Compare climate performance across regions, assets, or time periods
- Highlight risks, gaps, and priority actions with visual status markers
- Create a ESG reports reusing graphics from our climate-focused slides
All graphics are editable to modify the size, colors, and text. Additionally, you can expand the collection further with additional PPT symbols (see the Related Diagrams section).
You can easily modify all elements:
- Replace icons
- Change the filling and outline color
- Modify size and proportions
- Rotate, flip, align, and change order
Authors of this SDG presentation template