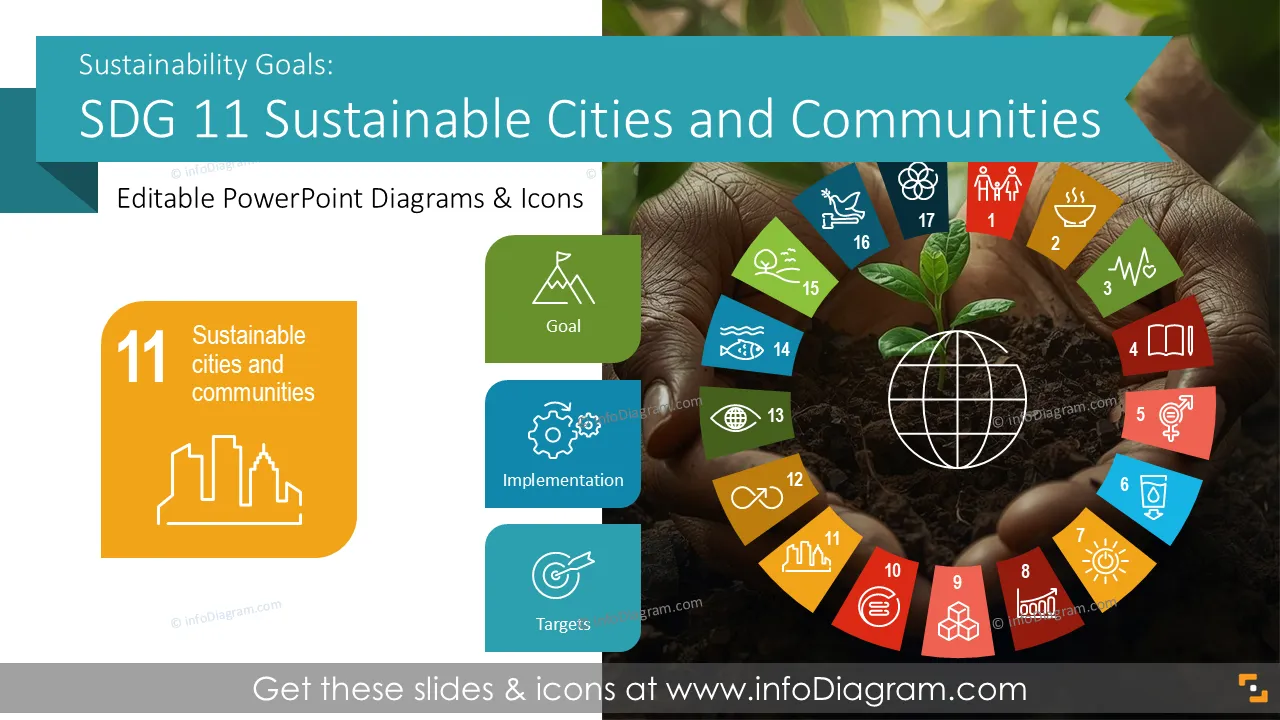
Are you presenting activities related to urban development or community well-being? Use our pre-designed Sustainable Development Goals SDG 11 Cities and Communities deck that incorporates urban targets, indicators, and progress visuals clearly and in professional way.
This SDG 11 PowerPoint template contains:
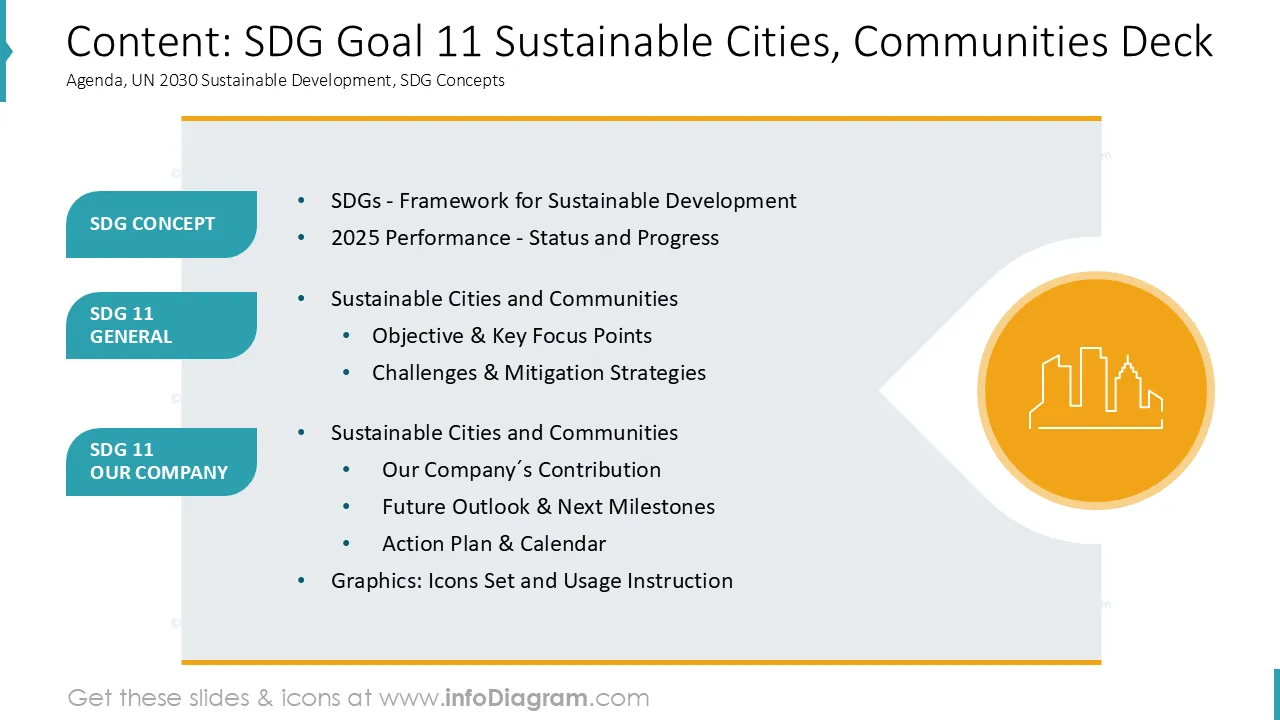
- 17 layouts with charts, tables, and diagrams illustrating various issues related to urban living, planning, housing, transport, public spaces, disaster resilience and various types of communities topics
- 30+ icons illustrating sustainability topics, 17 SDG goals, Work, Economy, Performance, Finances, Plan, Strategy, People, Clean Energy, or other general business concepts
- Instruction on modifying those diagrams using standard PowerPoint editing tools.
This PowerPoint slide deck is designed in a professional style with colorful vector illustrations and line icons. All graphic shapes can be recolored and resized without quality loss.
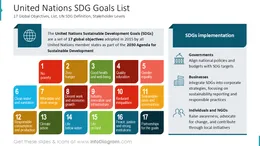
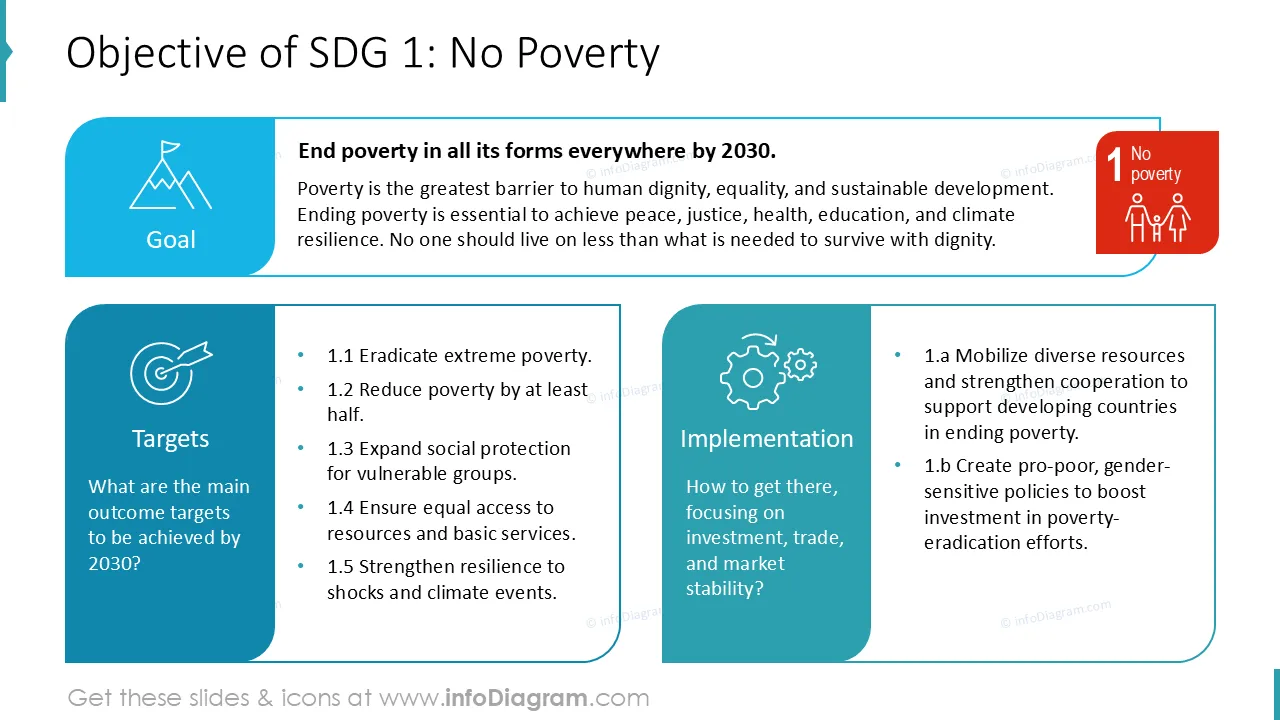
What is the UN sustainability goal 11 - Cities and Communities about?
SDG 11 is a United Nations Sustainable Development Goal focused on making cities and human settlements inclusive, safe, resilient, and sustainable. It covers urban planning, housing, transport, public spaces, and disaster resilience.
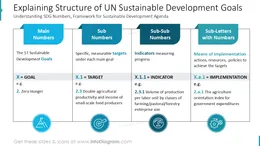
SDG 11 defines a structured framework to track urban sustainability performance using defined targets and indicators.
Why use a visual way for presenting Sustainable Cities and Communities (UN SDG 11)?
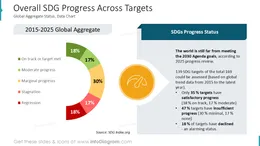
Urban topics often combine social, environmental, and infrastructure data. Visual slides help organize complex city indicators into clear messages.
Information visualization by drawing diagrams, tables, charts make those sustainability trends, risks, and progress easier to explain. Presenting those in a structured layouts support engagement by storytelling around livability and resilience.
Having a consistent PowerPoint template as a base keeps messaging aligned. Ready-made visuals save time and improve clarity in urban reporting.
These pre-designed SDG PowerPoint templates let’s you reuse our illustrations. All shapes and texts are editable. We also included instructions on editing colors and style.
How can you use the SDG 11 Cities and Communities PowerPoint visuals?
A few examples where you can use this SDG presentation template:
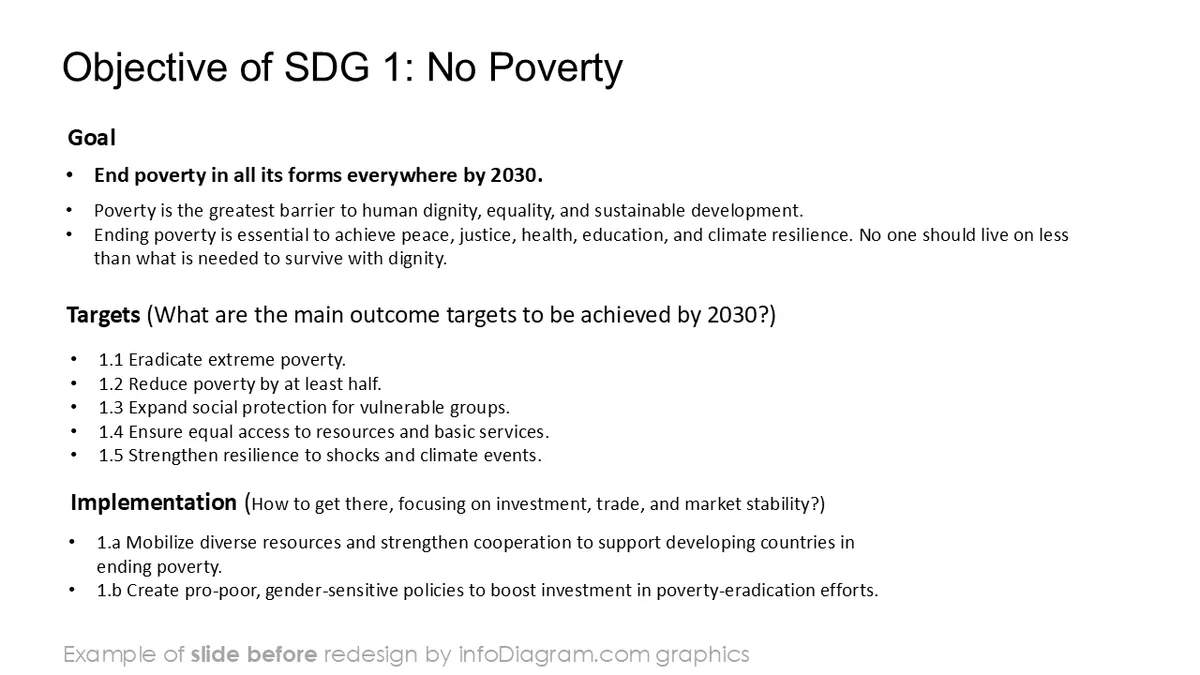
- Introduce SDG 11 goals, targets, and indicators in a concise overview
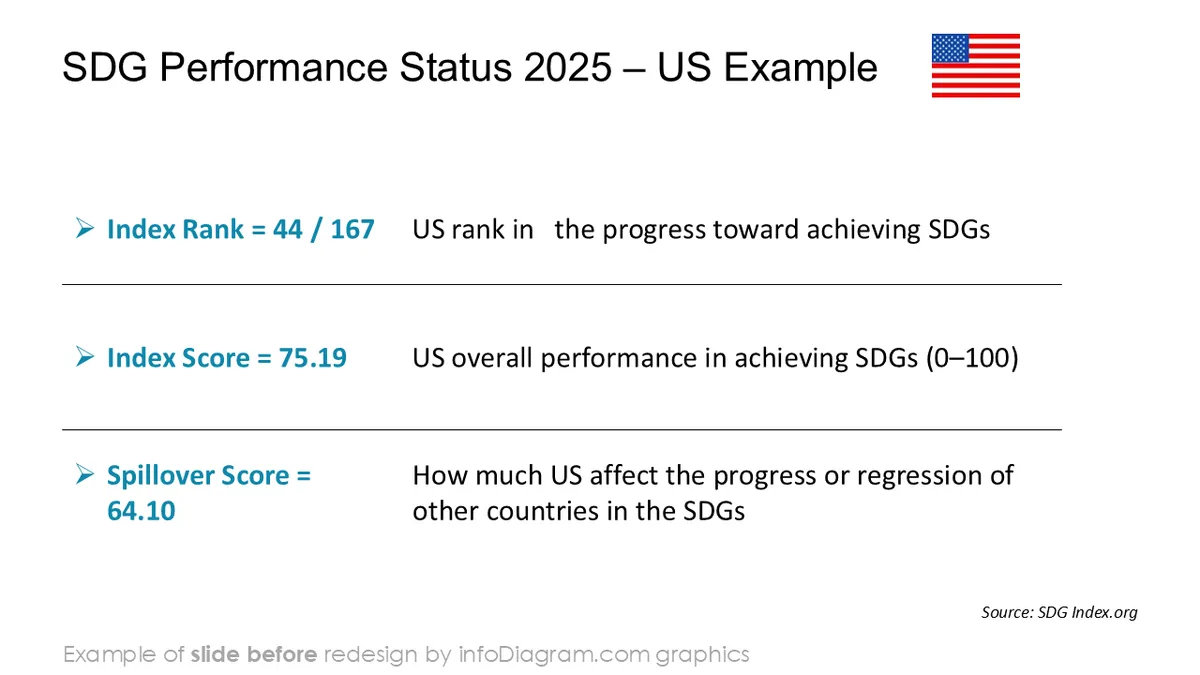
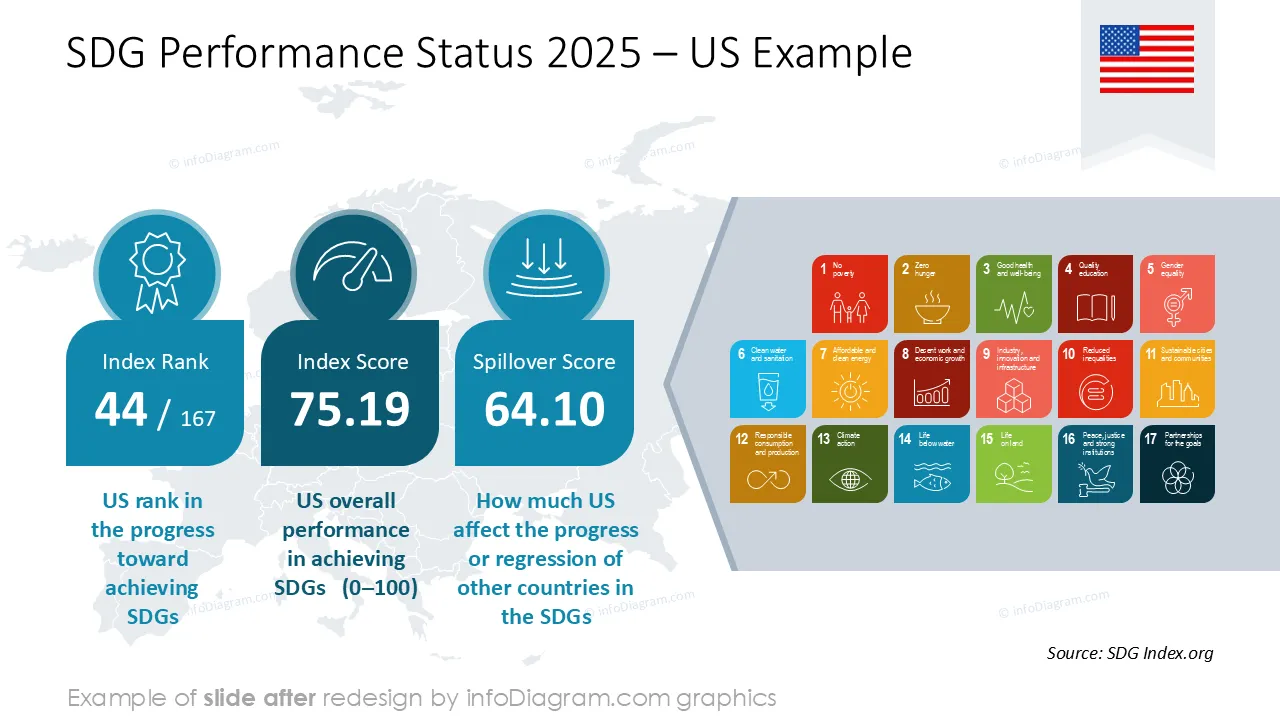
- Visualize urban KPIs such as housing access, transport, and public spaces
- Present smart city, resilience, and community development initiatives
- Support ESG, sustainability, or climate impact reports with city-focused slides
- Compare city or regional performance across time periods
- Highlight risks, gaps, and priority actions with visual status markers
All graphics are editable to modify the size, colors, and text. Additionally, you can expand the collection further with additional PPT symbols (see the Related Diagrams section).
You can easily modify all elements:
- Replace icons
- Change the filling and outline color
- Modify size and proportions
- Rotate, flip, align, and change order
Authors of this SDG presentation template