Do you need to present your actions and results on social inclusion, equal opportunities, and fair outcomes? Use our pre-designed Sustainable Development Goals SDG 10 Reduced Inequalities deck that incorporates inequality targets, indicators, and progress in a clear and professional way.
This SDG 10 PowerPoint template contains:
- 17 layouts with charts, tables, and diagrams illustrating various issues related to social inclusion, equal opportunity, and fair treatment topics
- 30+ icons illustrating sustainability topics, 17 SDG goals, Work, Economy, Performance, Finances, Plan, Strategy, People, Clean Energy, or other general business concepts
- Instruction on modifying those diagrams using standard PowerPoint editing tools.
This PowerPoint slide deck is designed in a professional style with colorful vector illustrations and line icons. All graphic shapes can be recolored and resized without quality loss.
Authors of this SDG presentation template
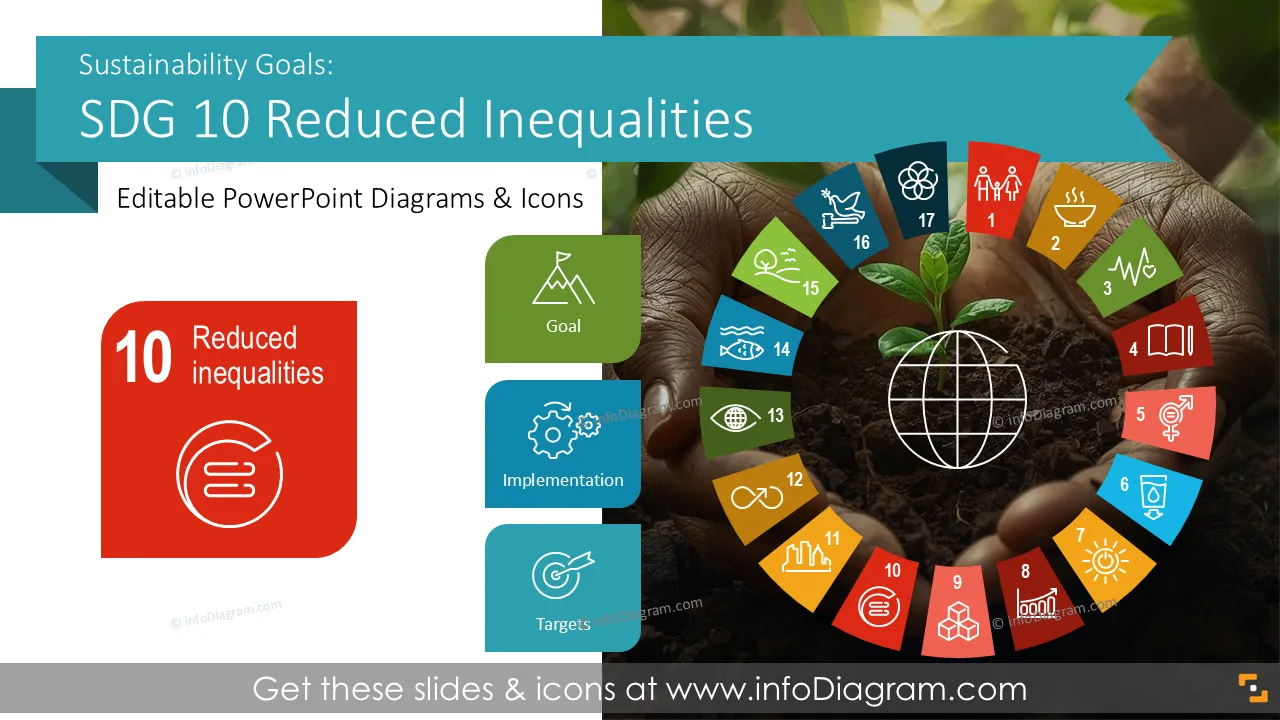
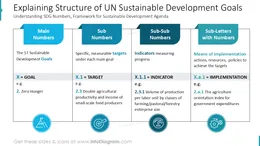
What is the UN sustainability goal SDG 10 about?
SDG 10 is a UN Sustainable Development Goal focused on reducing inequalities within and among countries.
It addresses income gaps, social inclusion, equal opportunity, and fair treatment across population groups. SDG 10 provides a shared framework to track inequality-related progress using defined targets and indicators.
Why use a visual aids for SDG 10 Reduced Inequalities presentation?
Inequality topics often involve sensitive data and complex social dimensions. Visual slides help structure indicators related to income, access, and inclusion. For example:
Charts and diagrams make disparities and trends easier to explain. Icons and clear layouts support consistent messaging across diverse audiences. And a structured PowerPoint template keeps your narrative aligned across reports and stakeholder updates.
Therefore, having ready-made visuals can save time and support clear, confident communication.
These pre-designed SDG PowerPoint templates let you reuse our illustrations. All shapes and texts are editable. We also included instructions on editing colors and style.
Where can you use the SDG 10 Reduced Inequalities PPT template?
Let me share some areas where you can use this SDG presentation to communicate inequality-focused initiatives:
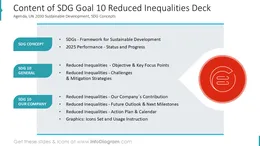
- Define and explain what are SDG 10 goals, targets, and indicators in a concise overview
- Present inclusion, diversity, and social mobility initiatives
- Visualize inequality KPIs such as income distribution, access, and representation
- Compare inequality data across regions, groups, or time periods
- Highlight gaps, risks, and priority actions with visual status markers
- Support ESG reporting with inclusion-focused slides
All graphics are editable to modify the size, colors, and text. Additionally, you can expand the collection further with additional PPT symbols (see the Related Diagrams section).
You can easily modify all elements:
- Replace icons
- Change the filling and outline color
- Modify size and proportions
- Rotate, flip, align, and change order