
Your graphics add a nice touch to my presentations and I recently used them for one of my all-hands meetings. Your toolbox adds professionalism to my slides. Instead of using standard clipart.
Claude Jones, Director of Engineer, @Walmartlabs, USA
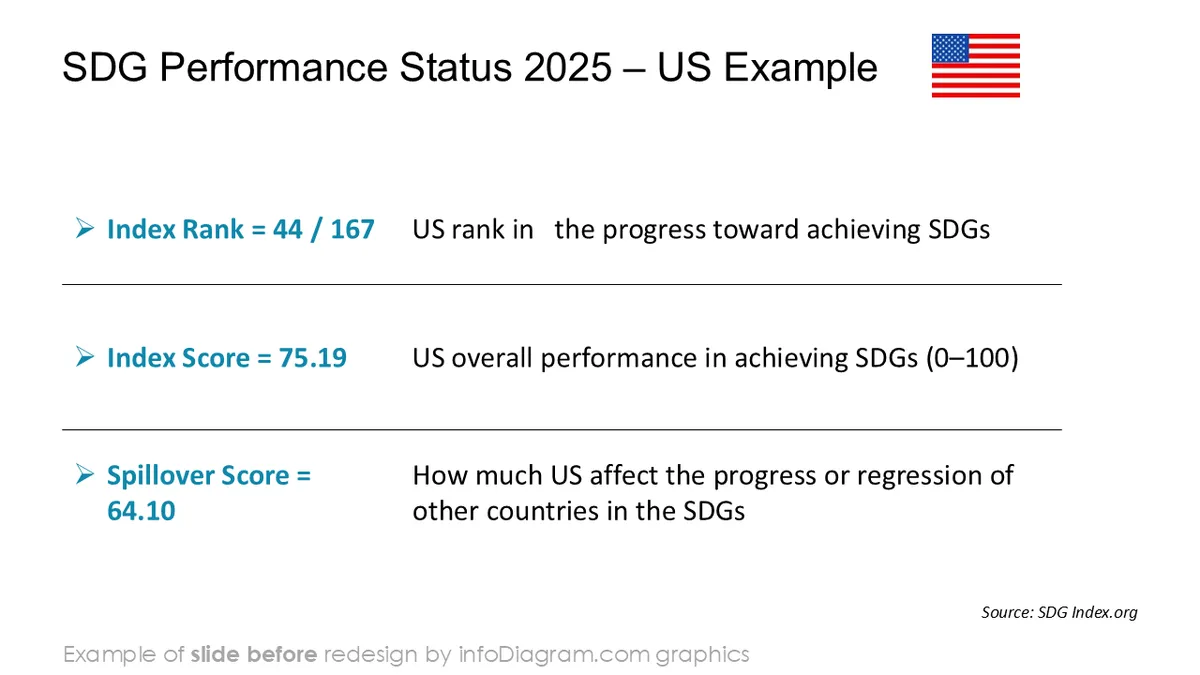
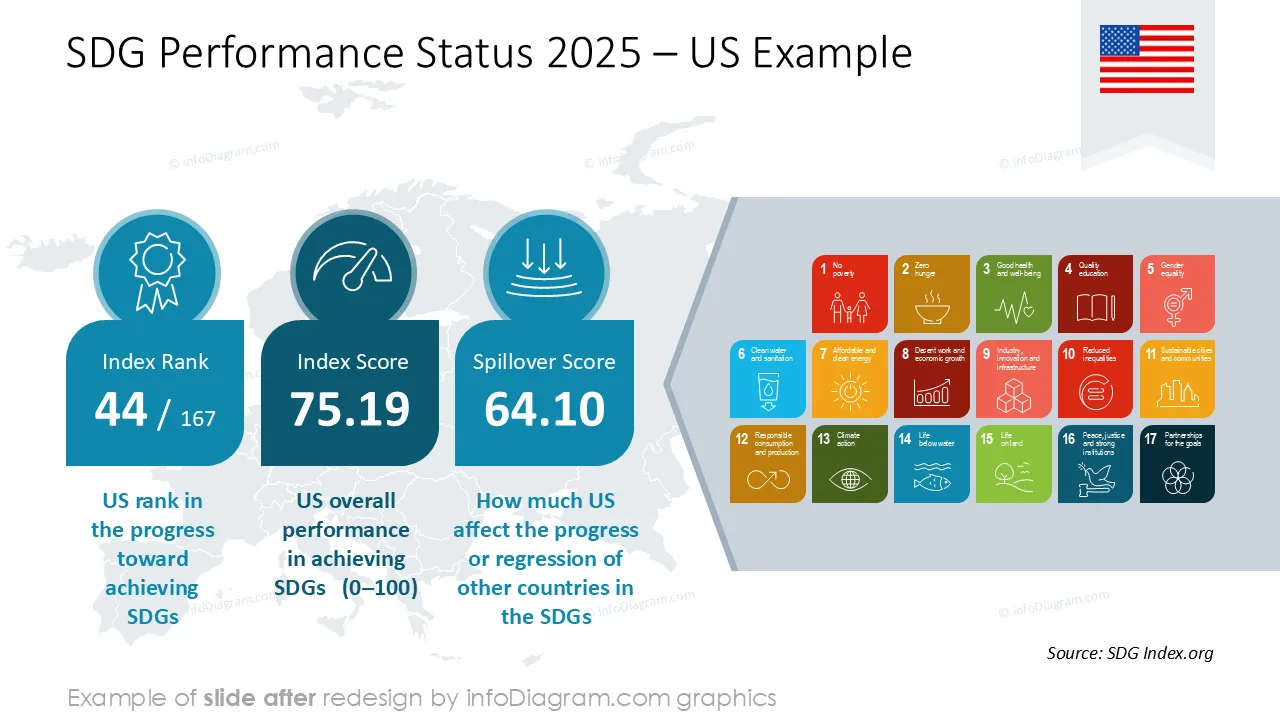
Before and after
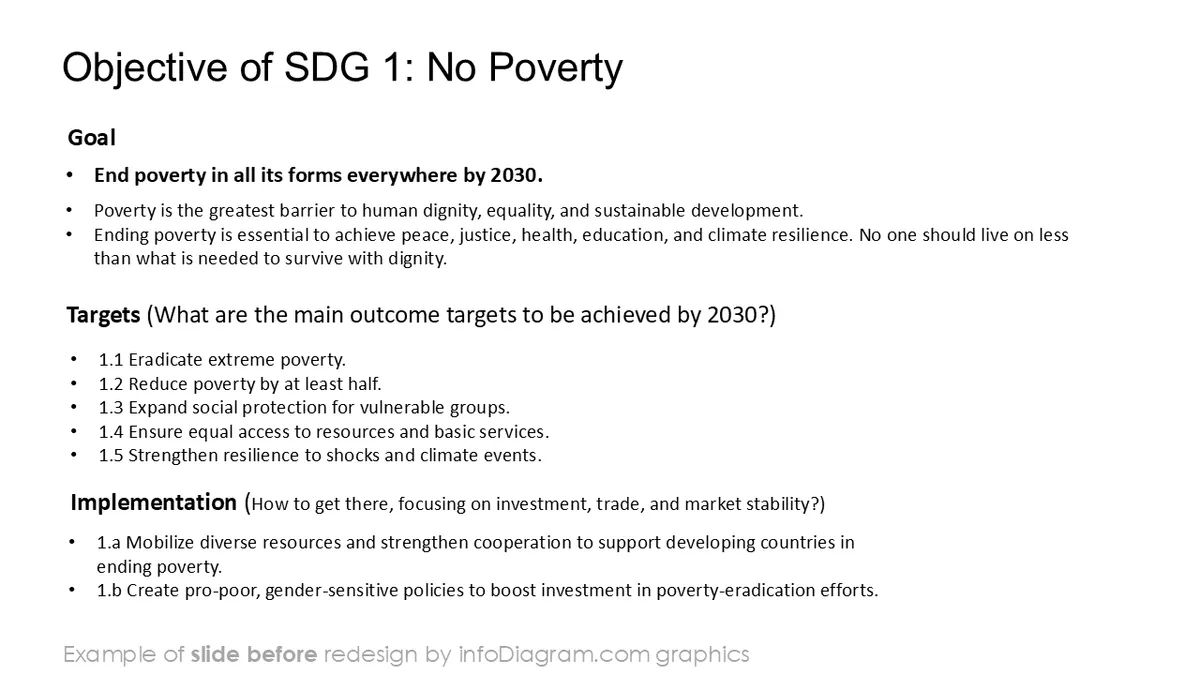
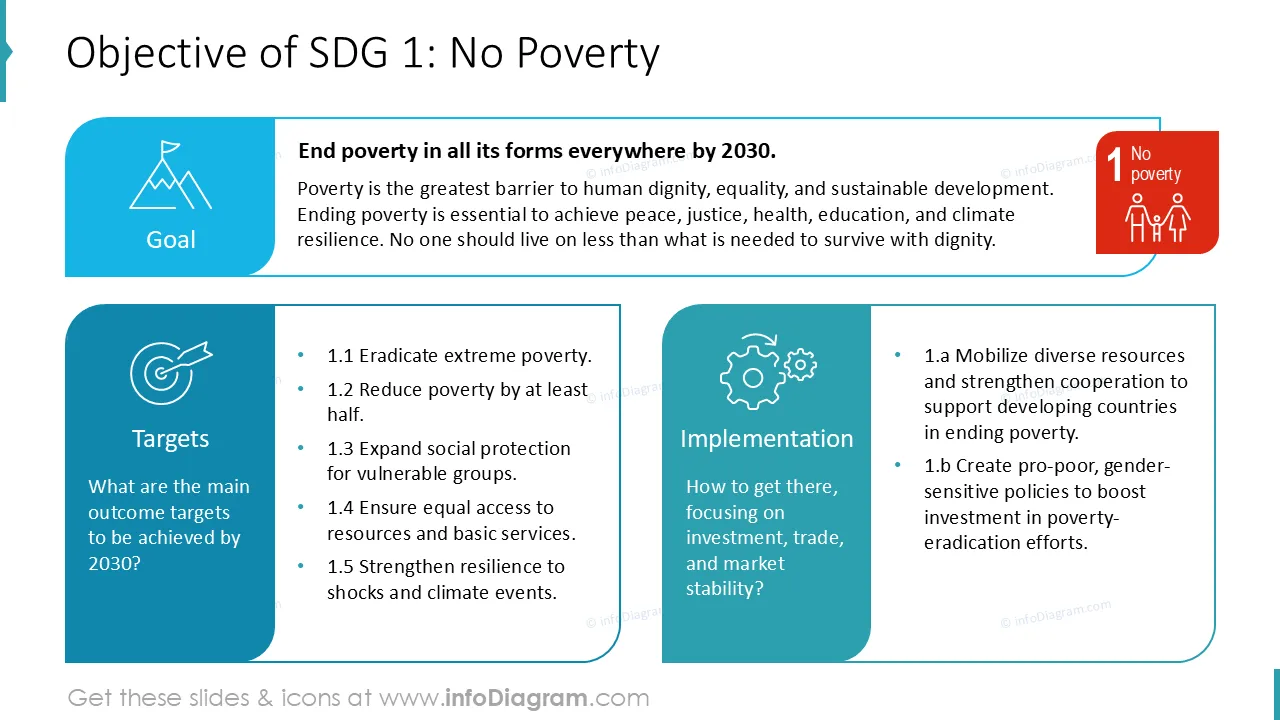
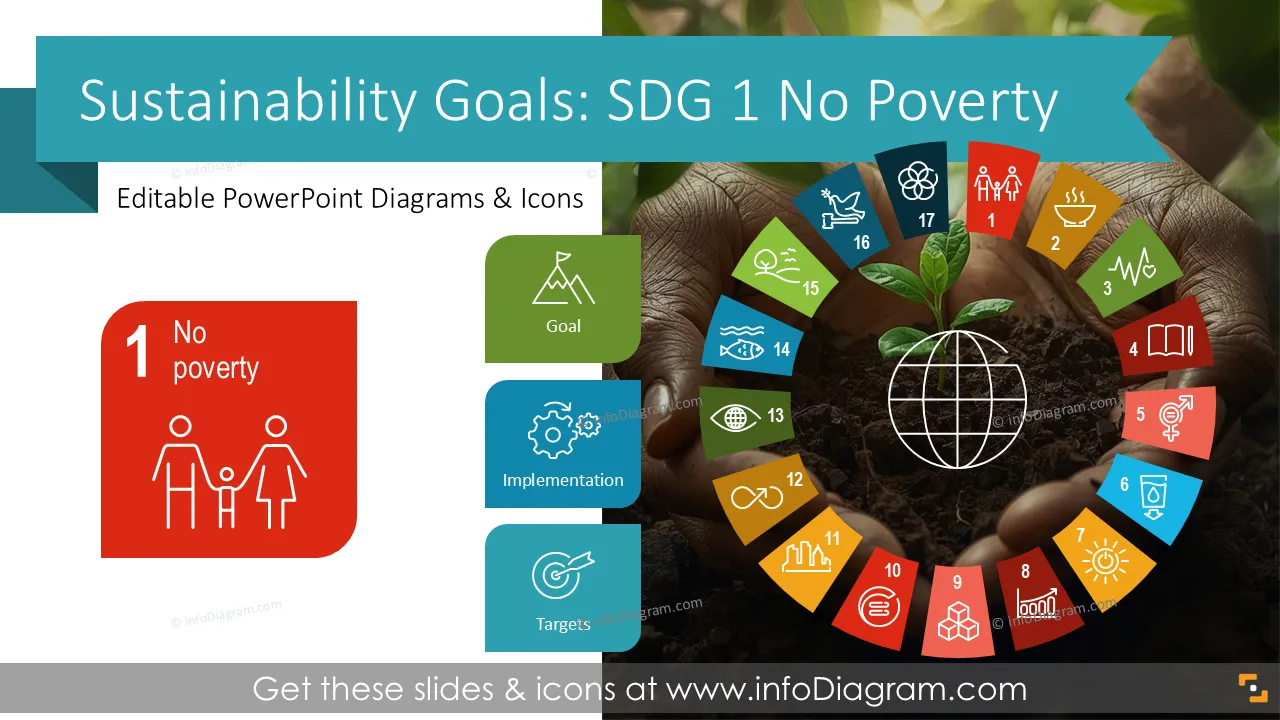
Do you present your Sustainable Development Goals (SDGs) results and need to explain SDG 1 – No Poverty target? Use our pre-designed SDG 1 No Poverty presentation that shows key poverty-related topics in a clear, visual way.
This PowerPoint slide deck is designed in an elegant, flat style with colorful vector illustrations and outline icons. All graphic shapes can be recolored and resized without quality loss.
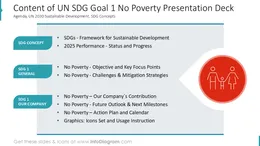
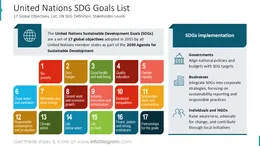
SDG 1 – No Poverty is one of the 17 UN Sustainable Development Goals that make up the global Framework for Sustainable Development. The goal aims to end extreme poverty, improve access to basic resources, and reduce the risk of people falling into poverty due to economic or climate shocks.
It focuses on social support systems, economic inclusion, and stable living conditions for communities. SDG 1 is a core building block for sustainable progress, guiding actions across public, private, and social sectors.
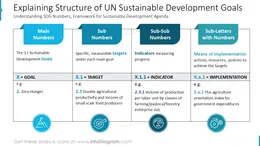
Presenting SDG 1 becomes much easier when information is visual. Talking about poverty indicators, social impact data, and economic risk patterns can be more understandable through charts, icons, and simple diagrams.
Visuals help audiences quickly see where progress is strong and where challenges remain. A ready-made template saves preparation time and allows teams to keep messaging consistent across reports.
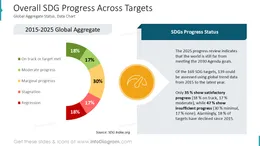
Dashboards show your SDG performance at a glance, while diagrams help explain what drives poverty and how planned actions can address it.
Clear visuals also support better discussions with leadership, partners, and community stakeholders. A structured slide deck helps you deliver your SDG story in a straightforward and professional way.
With this pre-designed SDG1 deck you can reapply our illustrations, change them quickly to your context. All shapes and texts are editable. We also included an instructions on editing colors and style.
This template helps you present SDG 1 updates, plans, and priorities in a simple visual format:
Try using those PowerPoint graphics to present your data visually in an elegant way.
All graphics are editable to modify the size, colors, and text. Also, you can extend the collection further with more PPT symbols (see Related Diagrams section).
Try using this set of fully editable PowerPoint vector shapes to present your data visually in an elegant way. You can easily modify all elements:
Your graphics add a nice touch to my presentations and I recently used them for one of my all-hands meetings. Your toolbox adds professionalism to my slides. Instead of using standard clipart.
Claude Jones, Director of Engineer, @Walmartlabs, USA
I needed a fresh look at some of my slides. I've tried to find a way to create a paintbrush effect, to underline, accentuate, add some color and the handwritten markers were just the things. Very easy to use, easy to size, change the color. It was an affordable, perfect solution and I'm happy to recommend it.
Anonymous, US
The crisp, clean look of the graphics, and the fact that it allowed me to easily edit and change the colors to match the template was my main reason for purchasing them.
Brandie Jenkins, E-learning Developer, USA


You may also need