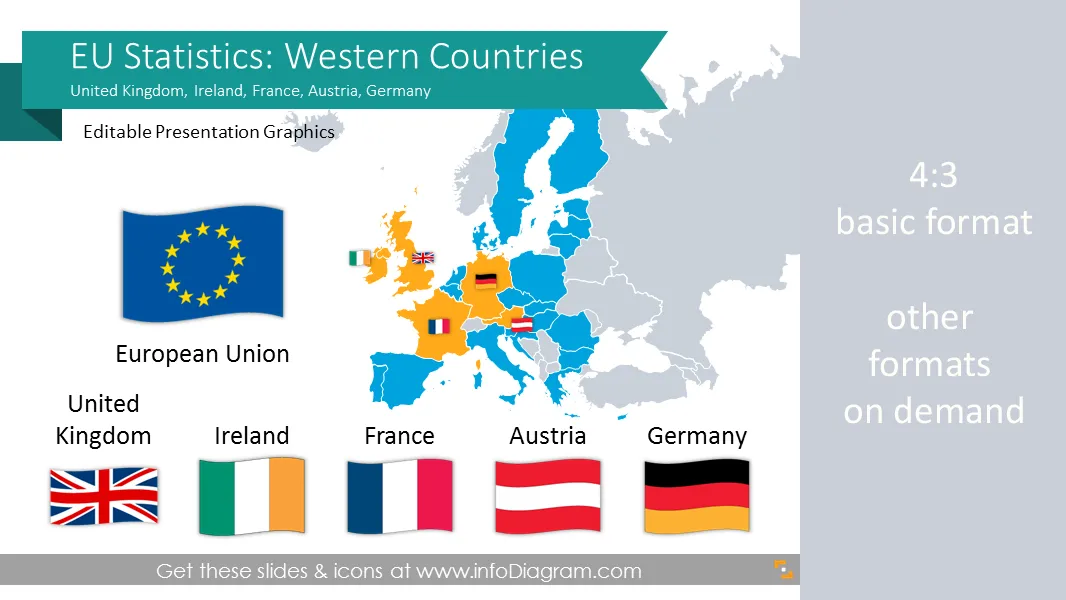
Cover and narrative setup
Usage example
Deck preview
What the deck looks like in practice
This template does not have a dedicated before/after case study, so we show the strongest slides from the actual deck instead.
Cover and narrative setup

Core structure and talking points
Polished visual slide from the deck
Description
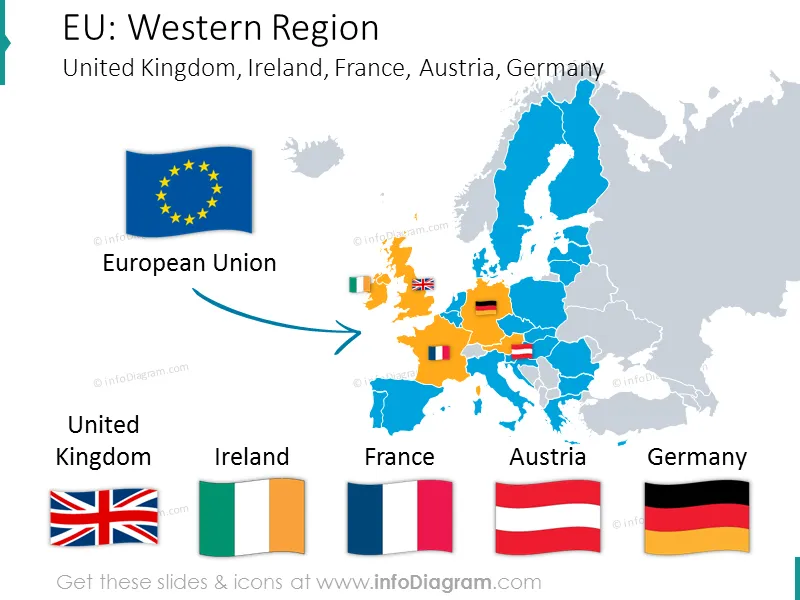
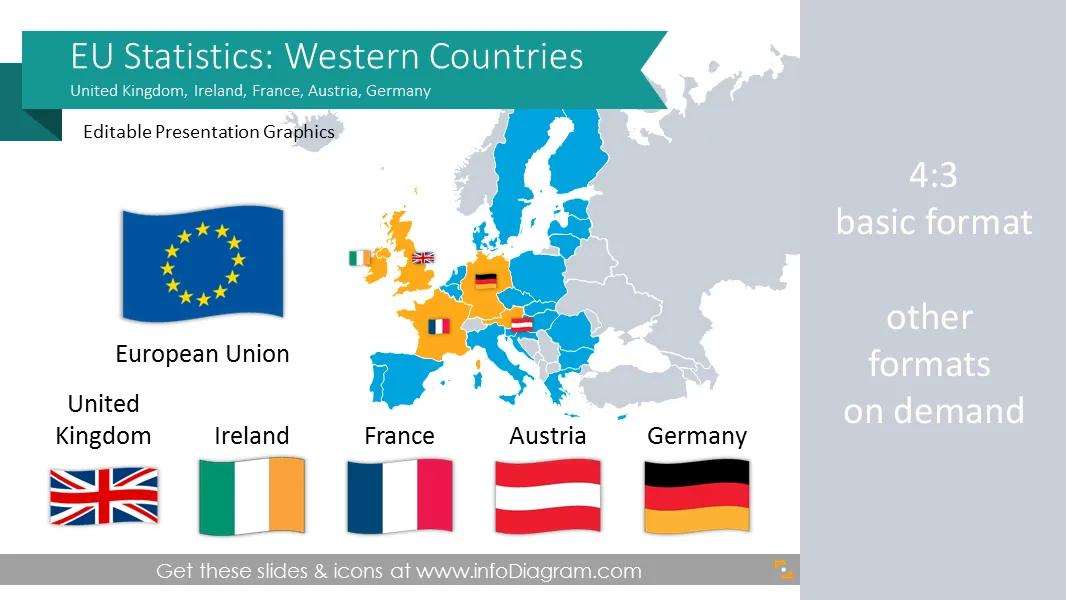
Editable visualizations of main macroeconomic statistics of France, Germany, United Kingdom, Ireland, Austria
- 43 Geographical maps and 6 flags
- 13 editable Excel data charts of EU countries macro-economical data based on EuroStat sources, comparisons of best and worst countries with specific indexes
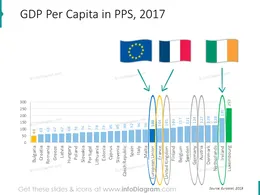
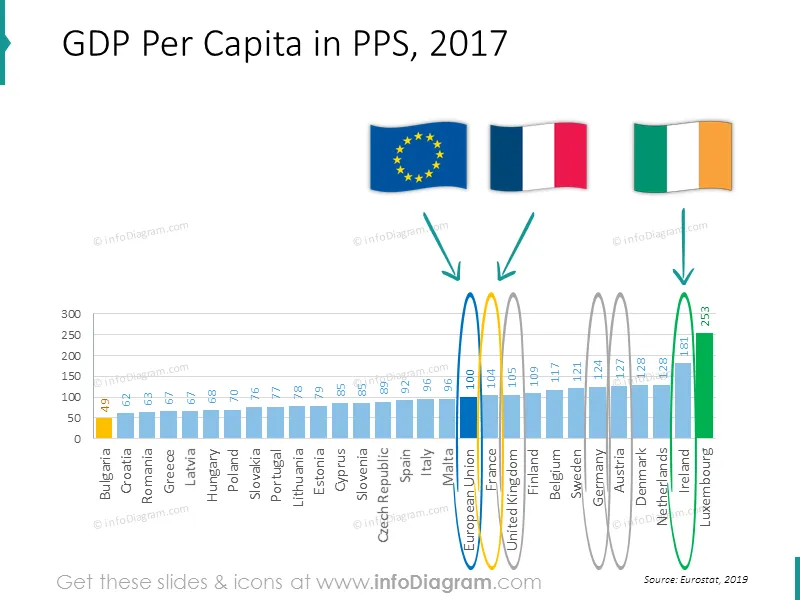
- GDP (Gross Domestic Product) comparison within european regions
- Government debt data charts
- Unemployment rate data charts
- Population size data charts
- Country macro-economy symbols & data: population, density, GDP, capital, transport, production, distribution
- Fully editable charts and marker arrows. Transparent flags and maps.
Macroeconomic Statistics
Comparing European Union average with Western EU countries (based on official Eurostat data)
- Public debt
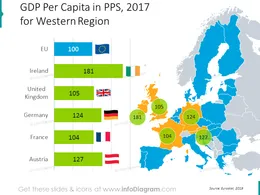
- GDP per capita, PPS
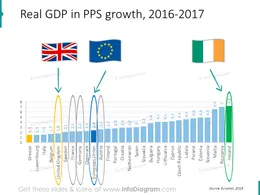
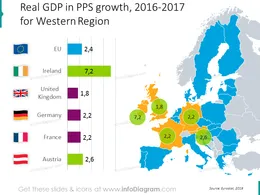
- GDP change
- Unemployment rate
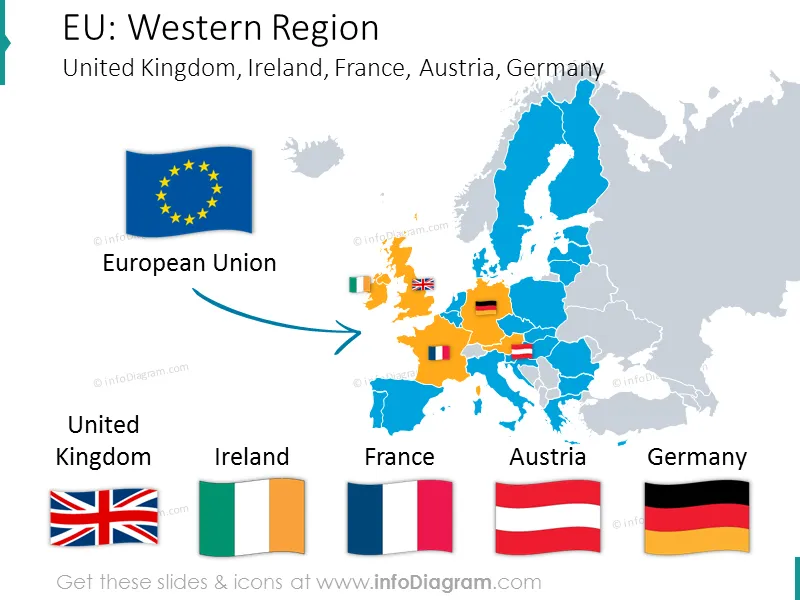
Western EU countries (members of European Union)
Basic country data:
- France (Wikipedia), French Economy (Wikipedia)
- Germany ( Wikipedia ), German Economy (Wikipedia)
- United Kingdom ( Wikipedia ), UK Economy (Wikipedia)
- Ireland ( Wikipedia ), Economy of Republic of Ireland (Wikipedia)
- Austria ( Wikipedia ), Austrian Economy (Wikipedia)
- European Union (Wikipedia)
Acronyms
- EU – European Union
- UK – United Kingdom
- Eurostat - statistical office of the European Union.
- GDP – Gross Domestic Product
- PPS - Purchasing Power Standards
Information sources
- Eurostat webpage - Statistical office of the European Union( Eurostat EN )
- Western Europe ( Wikipedia )
- Countries list by GDP ( Wikipedia )
- GDP comparisons by World Bank, International Monetary Fund, CIA World Factbook ( Wikipedia )
- The World Factbook 2009. Washington, DC: Central Intelligence Agency ( CIA Factbook )
Editable elements
Fully editable vector shapes by using built-in PowerPoint tools, including
- editing texts
- editing charts (data and look)
- arrows & markers: changing fill color, size
- all elements are transparent (charts, maps, flags, arrows), you can put them behind or above your content
See editing demonstration in our HowTo Videos.
Author
- infoDiagram contributor & Prezentio.com designers
- Contact: infoDiagram
Slides included in this PowerPoint Presentation:
- France Germany UK Ireland Austria-comparing-europe-economies-ppt
- gdp-chart-eu-france-germany-uk-ireland-ranking-powerpoint
- gdp-pps-france-germany-uk-ireland-austria-eu-chart-map-ppt
- gdp-growth-france-germany-uk-at-ire-eu-comparison-chart
- gdp-growth-france-germany-uk-at-ire-europe-chart-map-ppt
- debt-chart-eu-france-britain-ireland-germany-austria-ranking-ppt
- debt-ireland-france-britain-germany-eu-baltic-chart-map-ppt
- unemployment-ireland-france-britain-germany-eu-ranking-slide
- unemployment-ireland-france-uk-germany-austria-eu-map-bubblechart
- population-france-germany-uk-at-ire-western-europe-countries-comparison
- population-germany-united-kingdom-at-ire-fra-western-europe-chart-ppt-map
- EU Statistics: France Germany UK Ireland Austria economics
Reviews
Vos graphiques ajoutent une belle touche à mes présentations et je les ai récemment utilisés pour l'une de mes réunions générales. Votre boîte à outils ajoute du professionnalisme à mes diapositives. Au lieu d'utiliser des cliparts standards.
Claude Jones, Directeur de l'ingénierie, @Walmartlabs, USA
J'avais besoin d'un nouveau regard sur certaines de mes diapositives. J'ai essayé de trouver un moyen de créer un effet de pinceau, de souligner, d'accentuer, d'ajouter de la couleur et les marqueurs manuscrits étaient exactement ce qu'il fallait. Très facile à utiliser, facile à ajuster la taille, à changer la couleur. C'était une solution abordable et parfaite et je suis heureux de la recommander.
Anonymous, US
L'aspect net et épuré des graphiques, et le fait qu'il m'ait permis d'éditer et de changer facilement les couleurs pour les adapter au modèle, ont été les principales raisons de mon achat.
Brandie Jenkins, Développeur E-learning, USA

How to Edit
How to edit text & colors

How to expand / shorten diagram

How to Replace Icons in infoDiagram PPT

You may also need