Cover and narrative setup
Usage example
Deck preview
What the deck looks like in practice
This template does not have a dedicated before/after case study, so we show the strongest slides from the actual deck instead.
Cover and narrative setup
Core structure and talking points
Polished visual slide from the deck
Description
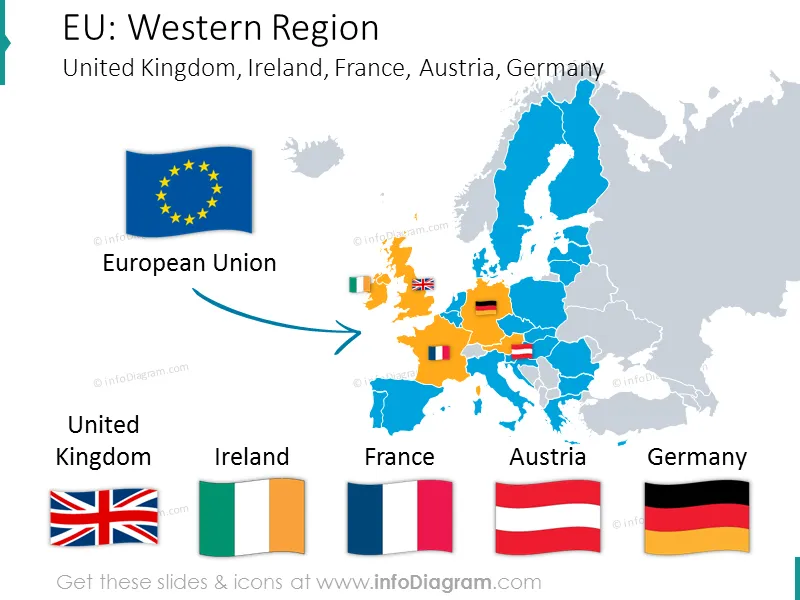
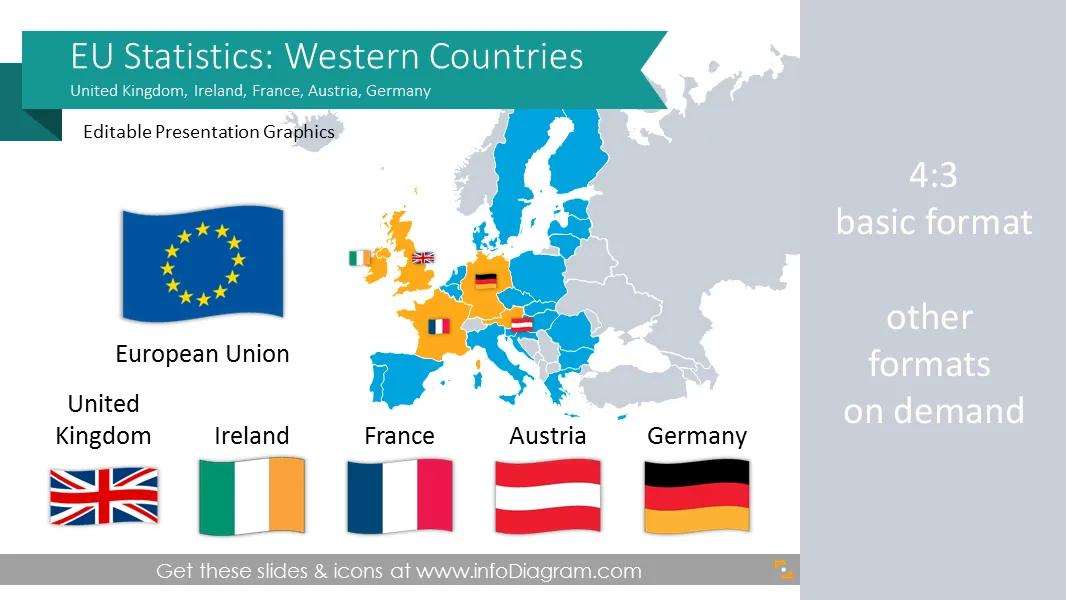
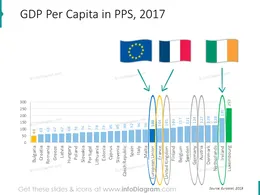
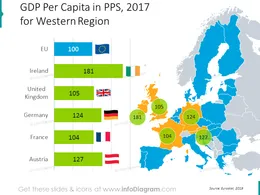
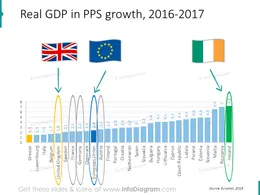
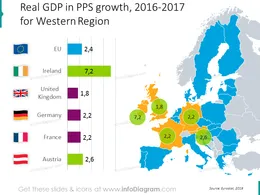
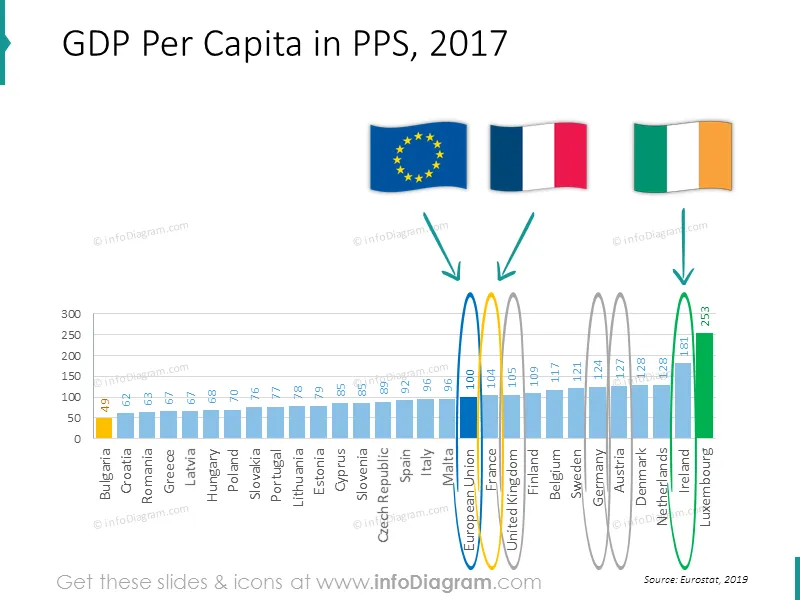
Editable visualizations of main macroeconomic statistics of France, Germany, United Kingdom, Ireland, Austria
- 43 Geographical maps and 6 flags
- 13 editable Excel data charts of EU countries macro-economical data based on EuroStat sources, comparisons of best and worst countries with specific indexes
- GDP (Gross Domestic Product) comparison within european regions
- Government debt data charts
- Unemployment rate data charts
- Population size data charts
- Country macro-economy symbols & data: population, density, GDP, capital, transport, production, distribution
- Fully editable charts and marker arrows. Transparent flags and maps.
Macroeconomic Statistics
Comparing European Union average with Western EU countries (based on official Eurostat data)
- Public debt
- GDP per capita, PPS
- GDP change
- Unemployment rate
Western EU countries (members of European Union)
Basic country data:
- France (Wikipedia), French Economy (Wikipedia)
- Germany ( Wikipedia ), German Economy (Wikipedia)
- United Kingdom ( Wikipedia ), UK Economy (Wikipedia)
- Ireland ( Wikipedia ), Economy of Republic of Ireland (Wikipedia)
- Austria ( Wikipedia ), Austrian Economy (Wikipedia)
- European Union (Wikipedia)
Acronyms
- EU – European Union
- UK – United Kingdom
- Eurostat - statistical office of the European Union.
- GDP – Gross Domestic Product
- PPS - Purchasing Power Standards
Information sources
- Eurostat webpage - Statistical office of the European Union( Eurostat EN )
- Western Europe ( Wikipedia )
- Countries list by GDP ( Wikipedia )
- GDP comparisons by World Bank, International Monetary Fund, CIA World Factbook ( Wikipedia )
- The World Factbook 2009. Washington, DC: Central Intelligence Agency ( CIA Factbook )
Editable elements
Fully editable vector shapes by using built-in PowerPoint tools, including
- editing texts
- editing charts (data and look)
- arrows & markers: changing fill color, size
- all elements are transparent (charts, maps, flags, arrows), you can put them behind or above your content
See editing demonstration in our HowTo Videos.
Author
- infoDiagram contributor & Prezentio.com designers
- Contact: infoDiagram
Slides included in this PowerPoint Presentation:
- France Germany UK Ireland Austria-comparing-europe-economies-ppt
- gdp-chart-eu-france-germany-uk-ireland-ranking-powerpoint
- gdp-pps-france-germany-uk-ireland-austria-eu-chart-map-ppt
- gdp-growth-france-germany-uk-at-ire-eu-comparison-chart
- gdp-growth-france-germany-uk-at-ire-europe-chart-map-ppt
- debt-chart-eu-france-britain-ireland-germany-austria-ranking-ppt
- debt-ireland-france-britain-germany-eu-baltic-chart-map-ppt
- unemployment-ireland-france-britain-germany-eu-ranking-slide
- unemployment-ireland-france-uk-germany-austria-eu-map-bubblechart
- population-france-germany-uk-at-ire-western-europe-countries-comparison
- population-germany-united-kingdom-at-ire-fra-western-europe-chart-ppt-map
- EU Statistics: France Germany UK Ireland Austria economics
Reviews
Ihre Grafiken verleihen meinen Präsentationen eine nette Note, und ich habe sie kürzlich für eines meiner All-Hands-Meetings verwendet. Ihre Toolbox verleiht meinen Folien Professionalität, anstatt Standard-Clipart zu verwenden.
Claude Jones, Leiter Entwicklung, @Walmartlabs, USA
Ich brauchte einen neuen Blick auf einige meiner Folien. Ich habe versucht, einen Weg zu finden, einen Pinselschlag-Effekt zu erzielen, um zu unterstreichen, hervorzuheben, Farbe hinzuzufügen, und die handgeschriebenen Markierungen waren genau das Richtige. Sehr einfach zu bedienen, leicht in der Größe zu ändern, die Farbe zu ändern. Es war eine erschwingliche, perfekte Lösung und ich empfehle sie gerne weiter.
Anonymous, US
Die klare, saubere Optik der Grafiken und die Tatsache, dass ich die Farben leicht bearbeiten und an die Vorlage anpassen konnte, war mein Hauptgrund für den Kauf.
Brandie Jenkins, E-Learning-Entwickler, USA
How to Edit
How to edit text & colors

How to expand / shorten diagram

How to Replace Icons in infoDiagram PPT

You may also need