

Your graphics add a nice touch to my presentations and I recently used them for one of my all-hands meetings. Your toolbox adds professionalism to my slides. Instead of using standard clipart.
Claude Jones, Director of Engineer, @Walmartlabs, USA

Your graphics add a nice touch to my presentations and I recently used them for one of my all-hands meetings. Your toolbox adds professionalism to my slides. Instead of using standard clipart.
Claude Jones, Director of Engineer, @Walmartlabs, USA
I needed a fresh look at some of my slides. I've tried to find a way to create a paintbrush effect, to underline, accentuate, add some color and the handwritten markers were just the things. Very easy to use, easy to size, change the color. It was an affordable, perfect solution and I'm happy to recommend it.
Anonymous, US
The crisp, clean look of the graphics, and the fact that it allowed me to easily edit and change the colors to match the template was my main reason for purchasing them.
Brandie Jenkins, E-learning Developer, USA
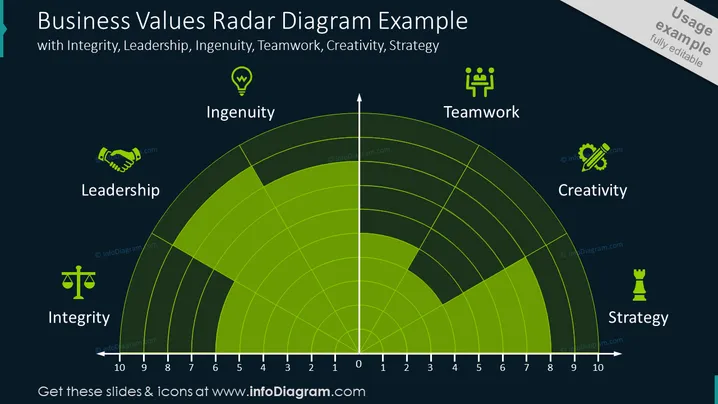
Die Folie mit dem Titel "Beispiel für ein Radar-Diagramm der Unternehmenswerte" veranschaulicht, wie ein Unternehmen sich an wichtigen Werten misst: Integrität, Führung, Einfallsreichtum, Teamarbeit, Kreativität und Strategie. Jede Achse repräsentiert einen dieser Werte und erstreckt sich nach außen, um das Maß darzustellen, in dem das Unternehmen diesen Wert verkörpert. Das radiale Diagramm zeigt das Ausmaß der Entwicklung jedes Wertes innerhalb der Organisation und bietet eine schnelle visuelle Einschätzung der Stärken des Unternehmens und der Bereiche, die verbessert werden können.
Die Folie ist sauber und visuell ansprechend und nutzt effektiv den Farbkontrast zwischen dem dunklen Hintergrund und den hellen Text-/Icon-Farben, um die Informationen hervorzuheben. Das Radar-Diagramm dient als Blickfang und bietet eine klare und kohärente visuelle Darstellung abstrakter Konzepte.



