

Your graphics add a nice touch to my presentations and I recently used them for one of my all-hands meetings. Your toolbox adds professionalism to my slides. Instead of using standard clipart.
Claude Jones, Director of Engineer, @Walmartlabs, USA

Your graphics add a nice touch to my presentations and I recently used them for one of my all-hands meetings. Your toolbox adds professionalism to my slides. Instead of using standard clipart.
Claude Jones, Director of Engineer, @Walmartlabs, USA
I needed a fresh look at some of my slides. I've tried to find a way to create a paintbrush effect, to underline, accentuate, add some color and the handwritten markers were just the things. Very easy to use, easy to size, change the color. It was an affordable, perfect solution and I'm happy to recommend it.
Anonymous, US
The crisp, clean look of the graphics, and the fact that it allowed me to easily edit and change the colors to match the template was my main reason for purchasing them.
Brandie Jenkins, E-learning Developer, USA
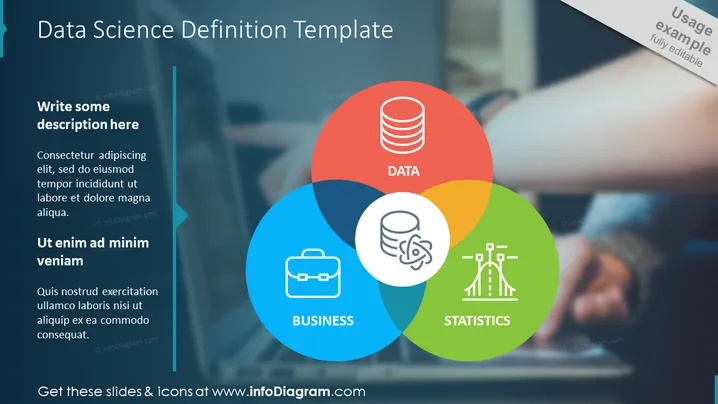
Die PowerPoint-Folie bietet eine visuelle Vorlage zur Definition von Datenwissenschaft, die drei Schlüsselbereiche miteinander verbindet: Daten, Geschäft und Statistik. 'Daten' repräsentiert den Kerninhalt der Datenwissenschaft und umfasst die rohen Informationen, die analysiert werden sollen. 'geschäft' impliziert den kommerziellen Kontext, in dem Datenwissenschaft angewendet wird, und hebt die Bedeutung der Ausrichtung an Unternehmenszielen hervor. 'Statistik' bezieht sich auf die mathematischen Grundlagen, die die Analyse von Daten und die Gewinnung von Erkenntnissen ermöglichen, entscheidend für fundierte Entscheidungen.
Die Folie hat ein modernes und ansprechendes Design, das visuell die Integration der Komponenten der Datenwissenschaft kommuniziert. Die Verwendung eines Venn-Diagramms über einem realen Bild veranschaulicht effektiv die konzeptionelle Überlappung der Datenwissenschaft mit praktischen Anwendungen.



