Your graphics add a nice touch to my presentations and I recently used them for one of my all-hands meetings. Your toolbox adds professionalism to my slides. Instead of using standard clipart.
Claude Jones, Director of Engineer, @Walmartlabs, USA
Your graphics add a nice touch to my presentations and I recently used them for one of my all-hands meetings. Your toolbox adds professionalism to my slides. Instead of using standard clipart.
Claude Jones, Director of Engineer, @Walmartlabs, USA
I needed a fresh look at some of my slides. I've tried to find a way to create a paintbrush effect, to underline, accentuate, add some color and the handwritten markers were just the things. Very easy to use, easy to size, change the color. It was an affordable, perfect solution and I'm happy to recommend it.
Anonymous, US
The crisp, clean look of the graphics, and the fact that it allowed me to easily edit and change the colors to match the template was my main reason for purchasing them.
Brandie Jenkins, E-learning Developer, USA
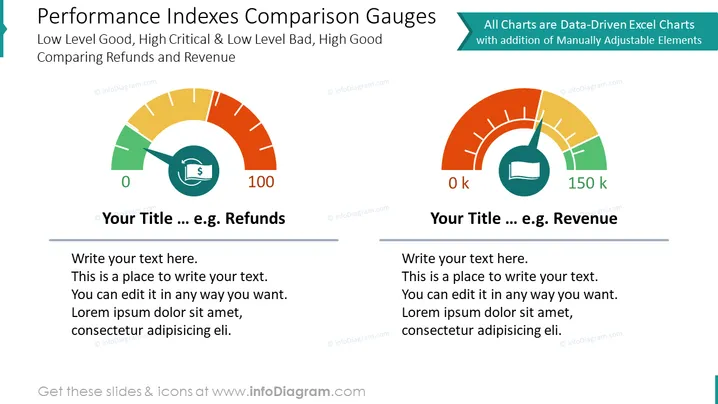
Die Folie veranschaulicht zwei Leistungsmessgeräte, die verschiedene Kennzahlen vergleichen, wobei 'Rückerstattungen' und 'Umsatz' als Beispiele angegeben werden. Das linke Messgerät zeigt einen Farbverlauf von grün nach rot, der darauf hindeutet, dass niedrige Werte gut und hohe Werte kritisch sind, was typischerweise auf Maße angewendet wird, bei denen eine niedrige Zahl bevorzugt wird, wie z.B. Rückerstattungs- oder Fehlerquoten. Das rechte Messgerät repräsentiert umgekehrt eine Kennzahl, bei der hohe Werte vorteilhaft sind, da es am oberen Ende grün gefärbt ist, was für KPIs wie Umsatz oder Verkaufsvolumen geeignet ist. Platzhaltertext unter jedem Messgerät deutet auf Anpassungsmöglichkeiten hin.
Die Folie hat ein kühnes, sauberes Design mit einer guten Balance von Grafiken und Text. Die kontrastierenden Farben lenken die Aufmerksamkeit auf die Messgeräte, die den Mittelpunkt bilden.


