

Your graphics add a nice touch to my presentations and I recently used them for one of my all-hands meetings. Your toolbox adds professionalism to my slides. Instead of using standard clipart.
Claude Jones, Director of Engineer, @Walmartlabs, USA

Your graphics add a nice touch to my presentations and I recently used them for one of my all-hands meetings. Your toolbox adds professionalism to my slides. Instead of using standard clipart.
Claude Jones, Director of Engineer, @Walmartlabs, USA
I needed a fresh look at some of my slides. I've tried to find a way to create a paintbrush effect, to underline, accentuate, add some color and the handwritten markers were just the things. Very easy to use, easy to size, change the color. It was an affordable, perfect solution and I'm happy to recommend it.
Anonymous, US
The crisp, clean look of the graphics, and the fact that it allowed me to easily edit and change the colors to match the template was my main reason for purchasing them.
Brandie Jenkins, E-learning Developer, USA
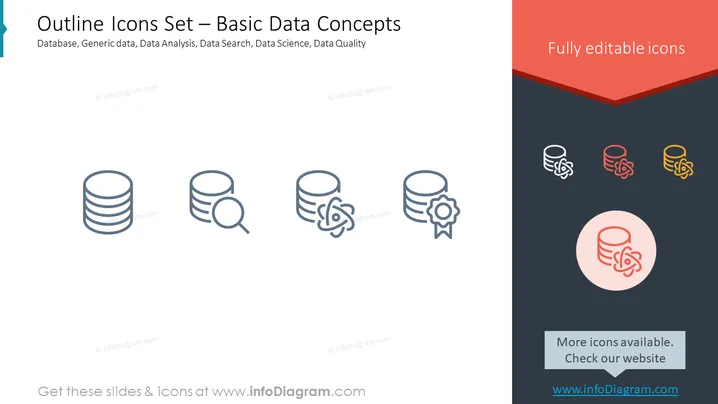
Die PowerPoint-Folie präsentiert ein Set von Outline-Icons, die grundlegende Konzepte im Zusammenhang mit Daten darstellen. Enthalten ist ein Icon für eine "Datenbank", das typischerweise Systeme für Datenspeicherung und -verwaltung symbolisiert. "Generische Daten" suggeriert jede Form von Daten, die verarbeitet werden kann. Das Icon "Datenanalyse" impliziert die Untersuchung von Datensätzen, um Erkenntnisse zu gewinnen. "Datensuche" zeigt den Prozess an, spezifische Informationen innerhalb eines großen Datensatzes zu finden. "Data Science" bezeichnet eine Disziplin, die Algorithmen und Systeme verwendet, um Wissen aus Daten zu extrahieren. Schließlich steht "Datenqualität" für die Genauigkeit und Zuverlässigkeit von Daten.



