

Your graphics add a nice touch to my presentations and I recently used them for one of my all-hands meetings. Your toolbox adds professionalism to my slides. Instead of using standard clipart.
Claude Jones, Director of Engineer, @Walmartlabs, USA

Your graphics add a nice touch to my presentations and I recently used them for one of my all-hands meetings. Your toolbox adds professionalism to my slides. Instead of using standard clipart.
Claude Jones, Director of Engineer, @Walmartlabs, USA
I needed a fresh look at some of my slides. I've tried to find a way to create a paintbrush effect, to underline, accentuate, add some color and the handwritten markers were just the things. Very easy to use, easy to size, change the color. It was an affordable, perfect solution and I'm happy to recommend it.
Anonymous, US
The crisp, clean look of the graphics, and the fact that it allowed me to easily edit and change the colors to match the template was my main reason for purchasing them.
Brandie Jenkins, E-learning Developer, USA
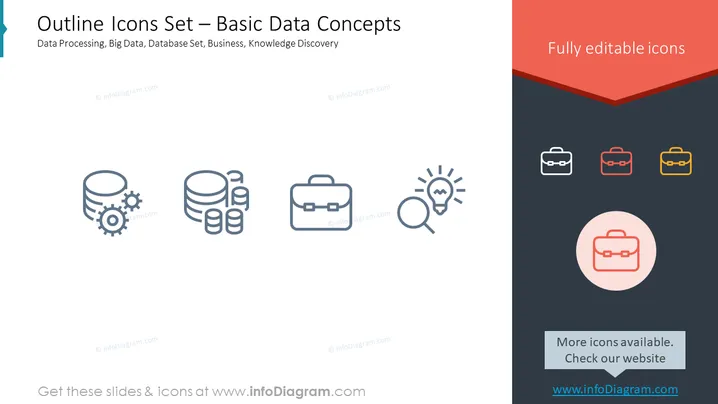
Die PowerPoint-Folie zeigt Icons, die grundlegende Datenkonzepte darstellen. Es gibt eine Darstellung der Datenverarbeitung (Zahnrad- und Datenbanksymbol), die eine Synergie zwischen mechanischen Prozessen und Datenspeicherung andeutet; Big Data wird durch mehrere Datenbankzylinder dargestellt, was auf das Volumen hindeutet; das Datensatz wird durch einen einzigen Datenbankzylinder symbolisiert; Geschäft wird durch einen Aktenkoffer repräsentiert, was auf den geschäftlichen oder professionellen Aspekt hinweist; Wissensentdeckung wird als Glühbirne mit einer Lupe dargestellt, was Einsicht und Suche anzeigt.
Die Folie hat ein modernes und sauberes Design mit einer minimalistischen Ästhetik, die Icons und farbigen Text verwendet, um visuelles Interesse zu erzeugen. Die Farbauswahl für Text und grafische Elemente ist koordiniert und verleiht der Folie ein professionelles Erscheinungsbild.



