Your graphics add a nice touch to my presentations and I recently used them for one of my all-hands meetings. Your toolbox adds professionalism to my slides. Instead of using standard clipart.
Claude Jones, Director of Engineer, @Walmartlabs, USA
Your graphics add a nice touch to my presentations and I recently used them for one of my all-hands meetings. Your toolbox adds professionalism to my slides. Instead of using standard clipart.
Claude Jones, Director of Engineer, @Walmartlabs, USA
I needed a fresh look at some of my slides. I've tried to find a way to create a paintbrush effect, to underline, accentuate, add some color and the handwritten markers were just the things. Very easy to use, easy to size, change the color. It was an affordable, perfect solution and I'm happy to recommend it.
Anonymous, US
The crisp, clean look of the graphics, and the fact that it allowed me to easily edit and change the colors to match the template was my main reason for purchasing them.
Brandie Jenkins, E-learning Developer, USA
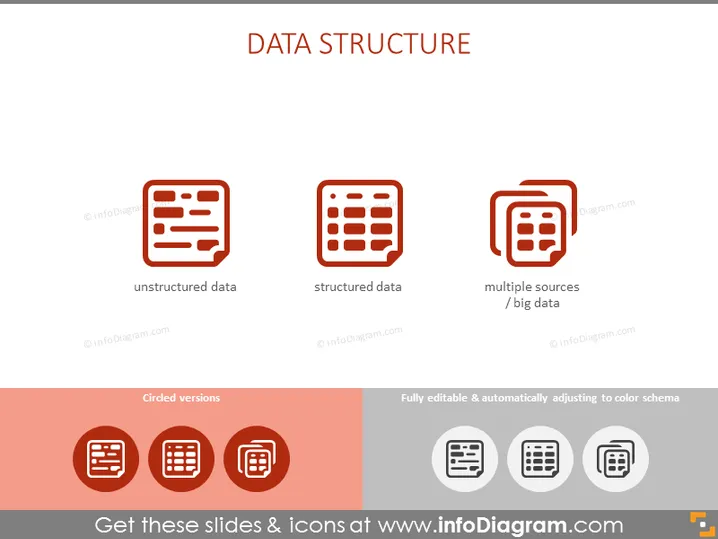
Die PowerPoint-Folie trägt den Titel "DATENSTRUKTUR" und weist drei Hauptpunkte auf. "Unstrukturierte Daten" beziehen sich auf Informationen, die kein festgelegtes Format einhalten, was das Sammeln, Verarbeiten und Analysieren erschwert. "Strukturierte Daten" bedeuten Daten, die in einem festen Feld innerhalb eines Datensatzes oder einer Datei organisiert sind, wie z.B. Tabellenkalkulationen, was die Suche erleichtert. "Mehrere Quellen / Big Data" deutet auf die Integration von Daten aus verschiedenen Repositories oder Formaten hin, was Komplexität und Umfang anzeigt.


