Your graphics add a nice touch to my presentations and I recently used them for one of my all-hands meetings. Your toolbox adds professionalism to my slides. Instead of using standard clipart.
Claude Jones, Director of Engineer, @Walmartlabs, USA
Your graphics add a nice touch to my presentations and I recently used them for one of my all-hands meetings. Your toolbox adds professionalism to my slides. Instead of using standard clipart.
Claude Jones, Director of Engineer, @Walmartlabs, USA
I needed a fresh look at some of my slides. I've tried to find a way to create a paintbrush effect, to underline, accentuate, add some color and the handwritten markers were just the things. Very easy to use, easy to size, change the color. It was an affordable, perfect solution and I'm happy to recommend it.
Anonymous, US
The crisp, clean look of the graphics, and the fact that it allowed me to easily edit and change the colors to match the template was my main reason for purchasing them.
Brandie Jenkins, E-learning Developer, USA
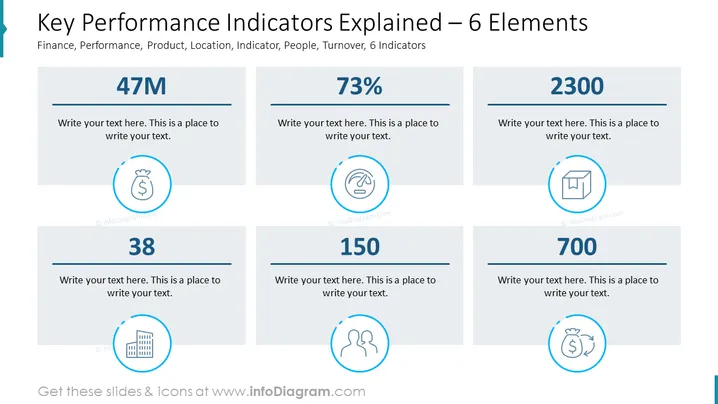
Die Folie präsentiert sechs Leistungskennzahlen (KPIs), die kritische Kennzahlen darstellen, die häufig zur Bewertung des Erfolgs einer Organisation in verschiedenen Bereichen verwendet werden. Jede KPI hat ein einzigartiges Symbol und Platzhaltertext, der eine Anpassung für spezifische Datenpunkte vorschlägt. Die Indikatoren sind wie folgt: eine Finanzkennzahl, dargestellt durch einen Geldbeutel, eine Leistungskennzahl, symbolisiert durch ein Geschwindigkeitsmesser, eine produktbezogene Kennzahl, angezeigt durch ein Boxensymbol, ein Standortsymbol, das eine orts- oder standortbezogene Kennzahl kennzeichnet, ein Personensymbol, das Personal- oder Mitarbeiterkennzahlen darstellt, und ein Umsatz- oder Finanztauschsymbol.
Das Gesamtbild der Folie ist sauber und geschäftlich, mit einem Fokus auf Einfachheit und Benutzerfreundlichkeit. Die Symbole sind visuell intuitiv und sorgen dafür, dass die KPIs sofort erkennbar sind.


