Your graphics add a nice touch to my presentations and I recently used them for one of my all-hands meetings. Your toolbox adds professionalism to my slides. Instead of using standard clipart.
Claude Jones, Director of Engineer, @Walmartlabs, USA
Your graphics add a nice touch to my presentations and I recently used them for one of my all-hands meetings. Your toolbox adds professionalism to my slides. Instead of using standard clipart.
Claude Jones, Director of Engineer, @Walmartlabs, USA
I needed a fresh look at some of my slides. I've tried to find a way to create a paintbrush effect, to underline, accentuate, add some color and the handwritten markers were just the things. Very easy to use, easy to size, change the color. It was an affordable, perfect solution and I'm happy to recommend it.
Anonymous, US
The crisp, clean look of the graphics, and the fact that it allowed me to easily edit and change the colors to match the template was my main reason for purchasing them.
Brandie Jenkins, E-learning Developer, USA
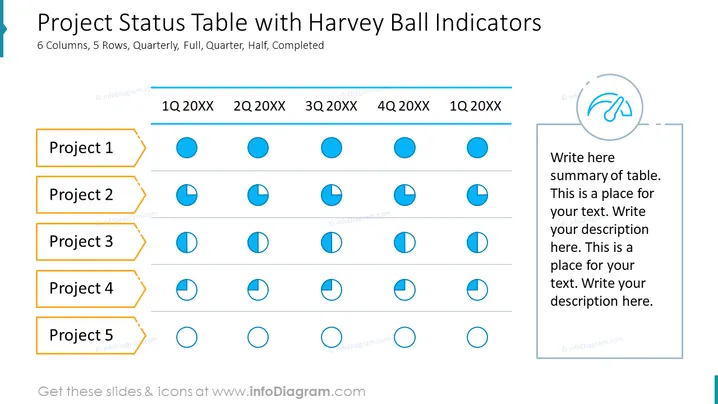
Die Folie präsentiert eine "Projektstatus-Tabelle mit Harvey Ball-Indikatoren", die entwickelt wurde, um den Fortschritt verschiedener Projekte über verschiedene Zeiträume hinweg zu verfolgen und zu kommunizieren. Jede Zeile stellt ein Projekt dar, benannt als Projekt 1 bis Projekt 5. Die Spalten entsprechen vierteljährlichen Zeitrahmen, speziell 2Q 20XX bis 1Q 20XX. Harvey Balls werden als visuelle Indikatoren des Abschlussgrades verwendet: volle Kreise für vollständigen Abschluss, halbe Kreise für halben Abschluss und Viertelkreise für Viertelabschluss. Ein zusätzliches Textfeld schlägt einen Bereich vor, um eine Zusammenfassung oder Beschreibung des Inhalts der Tabelle bereitzustellen.


