

Your graphics add a nice touch to my presentations and I recently used them for one of my all-hands meetings. Your toolbox adds professionalism to my slides. Instead of using standard clipart.
Claude Jones, Director of Engineer, @Walmartlabs, USA

Your graphics add a nice touch to my presentations and I recently used them for one of my all-hands meetings. Your toolbox adds professionalism to my slides. Instead of using standard clipart.
Claude Jones, Director of Engineer, @Walmartlabs, USA
I needed a fresh look at some of my slides. I've tried to find a way to create a paintbrush effect, to underline, accentuate, add some color and the handwritten markers were just the things. Very easy to use, easy to size, change the color. It was an affordable, perfect solution and I'm happy to recommend it.
Anonymous, US
The crisp, clean look of the graphics, and the fact that it allowed me to easily edit and change the colors to match the template was my main reason for purchasing them.
Brandie Jenkins, E-learning Developer, USA
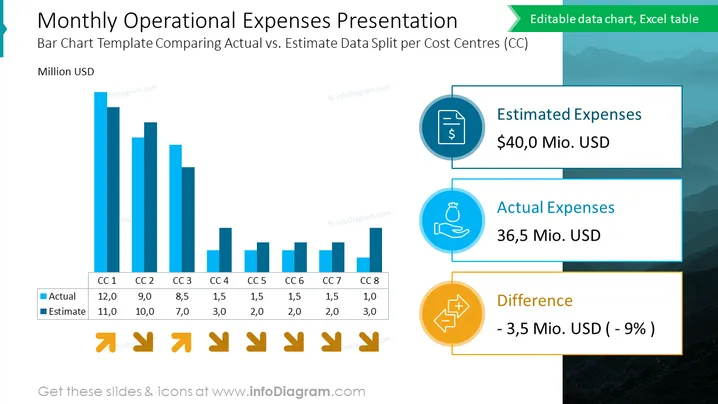
Die Folie zeigt einen Vergleich der geschätzten und tatsächlichen monatlichen Betriebskosten über acht Kostenstellen. Jede Kostenstelle hat ein Paar von Balken, die die tatsächlichen Ausgaben und das geschätzte Budget in Millionen USD darstellen, wobei die tatsächlichen Beträge in der Regel unter den Schätzungen liegen. Diese Daten deuten auf ein effektives Kostenmanagement hin. Es gibt auch Zusammenfassungen der insgesamt geschätzten Ausgaben, der insgesamt tatsächlichen Ausgaben und der daraus resultierenden Differenz, die als Prozentsatz hervorgehoben sind und eine günstige Abweichung von 9 % unter dem geschätzten Budget anzeigen.
Die Folie ist gut strukturiert mit einer klaren visuellen Hierarchie, die kontrastierende Farben und Symbole verwendet, um Finanzdaten effektiv zu kommunizieren. Der Gesamteindruck ist poliert und professionell, mit starkem Fokus auf grafische Datenrepräsentation.



