

Your graphics add a nice touch to my presentations and I recently used them for one of my all-hands meetings. Your toolbox adds professionalism to my slides. Instead of using standard clipart.
Claude Jones, Director of Engineer, @Walmartlabs, USA

Your graphics add a nice touch to my presentations and I recently used them for one of my all-hands meetings. Your toolbox adds professionalism to my slides. Instead of using standard clipart.
Claude Jones, Director of Engineer, @Walmartlabs, USA
I needed a fresh look at some of my slides. I've tried to find a way to create a paintbrush effect, to underline, accentuate, add some color and the handwritten markers were just the things. Very easy to use, easy to size, change the color. It was an affordable, perfect solution and I'm happy to recommend it.
Anonymous, US
The crisp, clean look of the graphics, and the fact that it allowed me to easily edit and change the colors to match the template was my main reason for purchasing them.
Brandie Jenkins, E-learning Developer, USA
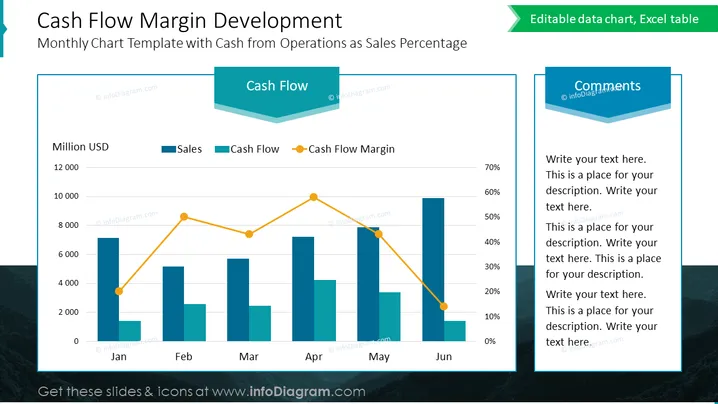
Die PowerPoint-Folie mit dem Titel "Entwicklung der Cashflow-Marge" bietet eine grafische Darstellung der monatlichen Diagrammvorlage mit dem Cashflow aus dem operativen Geschäft als Verkaufsprozent. Sie stellt zwei wichtige finanzielle Kennzahlen dar: Umsatz und Cashflow, die als Balken dargestellt sind, sowie die Cashflow-Marge, die als Liniendiagramm angezeigt wird. Die Cashflow-Marge wird in Prozent dargestellt und verfolgt die Rentabilitätsleistung im Verhältnis zu den Verkäufen über einen Zeitraum von sechs Monaten, von Januar bis Juni. Jedes Konzept klärt einen spezifischen finanziellen Aspekt: "Umsatz" definiert den Gesamtumsatz, "Cashflow" zeigt den Nettobetrag des in und aus einem Unternehmen transferierten Geldes an, und "Cashflow-Marge" misst, wie viele Cent Cashflow für jeden Dollar Umsatz generiert werden.
Die Folie ist professionell gestaltet mit einem klaren und einfachen Layout, das stark darauf fokussiert ist, Daten darzustellen. Der Einsatz von Farben ist konsistent und hilft, zwischen den verschiedenen Datenpräsentationen zu unterscheiden.



