

Your graphics add a nice touch to my presentations and I recently used them for one of my all-hands meetings. Your toolbox adds professionalism to my slides. Instead of using standard clipart.
Claude Jones, Director of Engineer, @Walmartlabs, USA

Your graphics add a nice touch to my presentations and I recently used them for one of my all-hands meetings. Your toolbox adds professionalism to my slides. Instead of using standard clipart.
Claude Jones, Director of Engineer, @Walmartlabs, USA
I needed a fresh look at some of my slides. I've tried to find a way to create a paintbrush effect, to underline, accentuate, add some color and the handwritten markers were just the things. Very easy to use, easy to size, change the color. It was an affordable, perfect solution and I'm happy to recommend it.
Anonymous, US
The crisp, clean look of the graphics, and the fact that it allowed me to easily edit and change the colors to match the template was my main reason for purchasing them.
Brandie Jenkins, E-learning Developer, USA
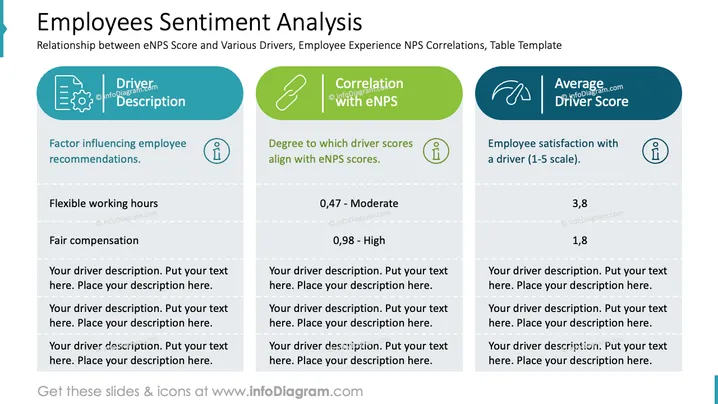
Die Folie behandelt die Beziehung zwischen dem Net Promoter Score (eNPS) der Mitarbeiter und verschiedenen Faktoren, die die Mitarbeiterstimmung beeinflussen. Der erste Abschnitt befasst sich mit Faktoren, die die Empfehlungen der Mitarbeiter beeinflussen, wie z. B. flexible Arbeitszeiten und faire Vergütung. Der zweite Abschnitt misst, wie die Fahrerwerte mit dem eNPS übereinstimmen, was auf eine moderate bis hohe Korrelation hinweist. Der dritte Abschnitt bewertet die Mitarbeiterzufriedenheit mit den Treibern auf einer Skala von 1-5 und zeigt unterschiedliche Zufriedenheitsniveaus.
Das allgemeine Erscheinungsbild der Folie ist professionell und visuell ansprechend, wobei Farbe und Ikonografie effektiv genutzt werden, um komplexe Daten einfach zu vermitteln. Dieses Setup gewährleistet, dass die Informationen für das Publikum zugänglich und leicht verständlich bleiben.



