Your graphics add a nice touch to my presentations and I recently used them for one of my all-hands meetings. Your toolbox adds professionalism to my slides. Instead of using standard clipart.
Claude Jones, Director of Engineer, @Walmartlabs, USA
Your graphics add a nice touch to my presentations and I recently used them for one of my all-hands meetings. Your toolbox adds professionalism to my slides. Instead of using standard clipart.
Claude Jones, Director of Engineer, @Walmartlabs, USA
I needed a fresh look at some of my slides. I've tried to find a way to create a paintbrush effect, to underline, accentuate, add some color and the handwritten markers were just the things. Very easy to use, easy to size, change the color. It was an affordable, perfect solution and I'm happy to recommend it.
Anonymous, US
The crisp, clean look of the graphics, and the fact that it allowed me to easily edit and change the colors to match the template was my main reason for purchasing them.
Brandie Jenkins, E-learning Developer, USA
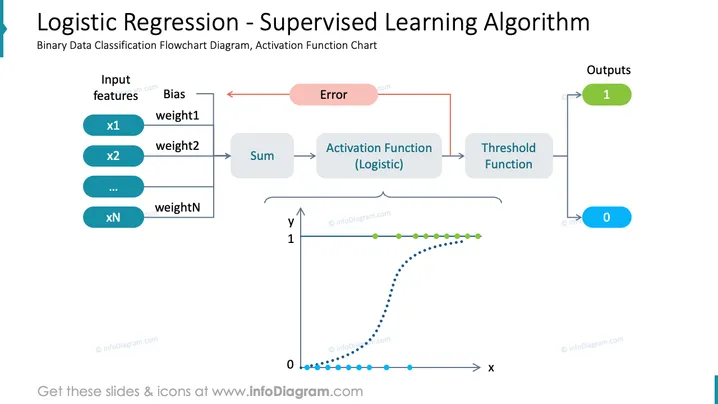
Die PowerPoint-Folie präsentiert das Konzept der logistischen Regression, die ein überwachter Lernalgorithmus zur Klassifizierung von Binärdaten ist. Sie zeigt ein Flussdiagramm mit Eingangsmerkmalen (x1, x2, ..., xN), die jeweils mit einem entsprechenden Gewicht multipliziert und summiert werden, bevor sie durch eine logistische Aktivierungsfunktion geleitet werden. Die Ausgabe wird dann durch eine Schwellenwertfunktion entschieden, was zu binären Ausgaben (0 oder 1) führt. Eine Fehler-Rückkopplungsschleife deutet auf eine Anpassung des Modells basierend auf der Vorhersagegenauigkeit hin.
Der Gesamteindruck der Folie ist klar und nutzt Farbcode, um zwischen verschiedenen Elementen des logistischen Regressionsprozesses zu unterscheiden. Die grafischen Elemente wie Pfeile, Rechtecke und Kreise sind in einer Flussdiagramm-Anordnung angeordnet, um die Reihenfolge der Ereignisse in der logistischen Regression zu beschreiben.


