Your graphics add a nice touch to my presentations and I recently used them for one of my all-hands meetings. Your toolbox adds professionalism to my slides. Instead of using standard clipart.
Claude Jones, Director of Engineer, @Walmartlabs, USA
Your graphics add a nice touch to my presentations and I recently used them for one of my all-hands meetings. Your toolbox adds professionalism to my slides. Instead of using standard clipart.
Claude Jones, Director of Engineer, @Walmartlabs, USA
I needed a fresh look at some of my slides. I've tried to find a way to create a paintbrush effect, to underline, accentuate, add some color and the handwritten markers were just the things. Very easy to use, easy to size, change the color. It was an affordable, perfect solution and I'm happy to recommend it.
Anonymous, US
The crisp, clean look of the graphics, and the fact that it allowed me to easily edit and change the colors to match the template was my main reason for purchasing them.
Brandie Jenkins, E-learning Developer, USA
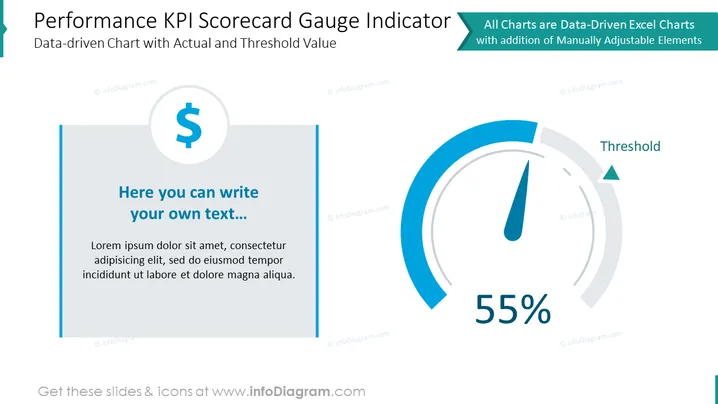
Die Folie konzentriert sich darauf, einen "Leistungs-KPI Scorecard Gauge Indicator" zu präsentieren, der einen datengestützten Ansatz zur Messung von Schlüssel-Leistungsindikatoren (KPIs) veranschaulicht. Sie stellt die tatsächliche Leistung einem vordefinierten Schwellenwert gegenüber, um einen Überblick darüber zu geben, wie gut die Ziele erreicht werden. Die Folie ist in zwei separate Abschnitte unterteilt: Der linke Abschnitt enthält einen Platzhalter für Text mit einem Dollar-Symbol, was auf einen finanziellen Kontext hindeutet, während der rechte Abschnitt ein Gauge-Diagramm mit der Bezeichnung "Schwellenwert" und einem Leistungsindikator von 55% zeigt, was eine einfach interpretierbare visuelle Darstellung des KPI-Erreichens bietet.
Die Folie hat ein sauberes und modernes Erscheinungsbild mit einem professionellen Blau- und Grauton. Das Layout ist ausgewogen, mit dem Text auf der linken Seite und der Gauge-Grafik auf der rechten Seite, um eine klare visuelle Unterscheidung zwischen textlicher Information und Datenvisualisierung zu schaffen.


