
Your graphics add a nice touch to my presentations and I recently used them for one of my all-hands meetings. Your toolbox adds professionalism to my slides. Instead of using standard clipart.
Claude Jones, Director of Engineer, @Walmartlabs, USA
Your graphics add a nice touch to my presentations and I recently used them for one of my all-hands meetings. Your toolbox adds professionalism to my slides. Instead of using standard clipart.
Claude Jones, Director of Engineer, @Walmartlabs, USA
I needed a fresh look at some of my slides. I've tried to find a way to create a paintbrush effect, to underline, accentuate, add some color and the handwritten markers were just the things. Very easy to use, easy to size, change the color. It was an affordable, perfect solution and I'm happy to recommend it.
Anonymous, US
The crisp, clean look of the graphics, and the fact that it allowed me to easily edit and change the colors to match the template was my main reason for purchasing them.
Brandie Jenkins, E-learning Developer, USA
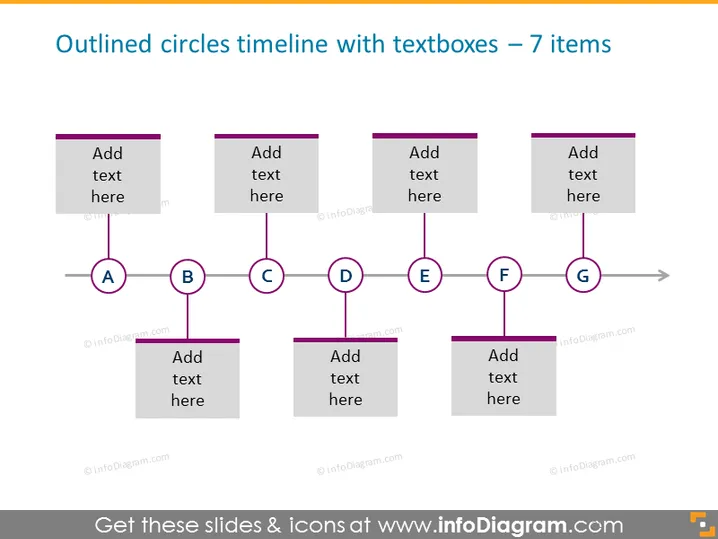
Die Folie präsentiert eine Zeitachse mit sieben Phasen, dargestellt durch umrissene Kreise, die von ‚A‘ bis ‚G‘ beschriftet sind. Jeder Kreis ist durch eine horizontale Linie verbunden, die eine Folge oder Entwicklung über die Zeit andeutet. Die Kreise sind horizontal ausgerichtet und über ihren entsprechenden Textfeldern platziert, die den Präsentierenden auffordern, "Fügen Sie hier Text hinzu." Diese Anordnung impliziert, dass jedes Paar aus Kreis und Textfeld einen diskreten Schritt oder ein Ereignis innerhalb eines größeren Prozesses oder einer Zeitachse darstellt. Jede Phase ist dazu gedacht, einen spezifischen Teil eines Prozesses oder eine Abfolge von Ereignissen zu detaillieren.




