Your graphics add a nice touch to my presentations and I recently used them for one of my all-hands meetings. Your toolbox adds professionalism to my slides. Instead of using standard clipart.
Claude Jones, Director of Engineer, @Walmartlabs, USA
Your graphics add a nice touch to my presentations and I recently used them for one of my all-hands meetings. Your toolbox adds professionalism to my slides. Instead of using standard clipart.
Claude Jones, Director of Engineer, @Walmartlabs, USA
I needed a fresh look at some of my slides. I've tried to find a way to create a paintbrush effect, to underline, accentuate, add some color and the handwritten markers were just the things. Very easy to use, easy to size, change the color. It was an affordable, perfect solution and I'm happy to recommend it.
Anonymous, US
The crisp, clean look of the graphics, and the fact that it allowed me to easily edit and change the colors to match the template was my main reason for purchasing them.
Brandie Jenkins, E-learning Developer, USA
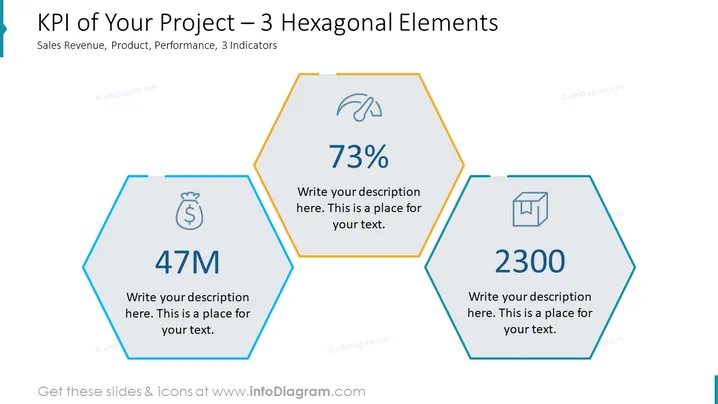
Die Folie konzentriert sich darauf, drei Key Performance Indicators (KPIs) eines Projekts zu präsentieren, wobei hexagonale Formen verwendet werden, um jede Kennzahl hervorzuheben. Das erste Hexagon zeigt eine Zahl von "47M", die wahrscheinlich eine finanzielle Kennzahl darstellt, wie zum Beispiel den Verkaufsumsatz, begleitet von einem Dollarzeichen-Icon, das auf geldbezogene Daten hinweist. Das zentrale Hexagon zeigt "73%" mit einem Messgerät-Icon, was ein Leistungsniveau oder eine Erfolgsquote darstellen könnte. Das dritte Hexagon listet "2300" neben einem Kasten-Icon, was Produktstatistiken symbolisieren könnte, wie verkaufte Einheiten oder Lagerbestand. Jedes Hexagon hat Platz für zusätzliche Beschreibungen.
Die Folie präsentiert ein sauberes und ausgewogenes Layout mit hexagonalen Formen, die die wichtigsten Kennzahlen ins Rampenlicht rücken. Der Einsatz von Icons und fetten Zahlen hilft, die KPIs visuell schnell zu vermitteln.


