Your graphics add a nice touch to my presentations and I recently used them for one of my all-hands meetings. Your toolbox adds professionalism to my slides. Instead of using standard clipart.
Claude Jones, Director of Engineer, @Walmartlabs, USA
Your graphics add a nice touch to my presentations and I recently used them for one of my all-hands meetings. Your toolbox adds professionalism to my slides. Instead of using standard clipart.
Claude Jones, Director of Engineer, @Walmartlabs, USA
I needed a fresh look at some of my slides. I've tried to find a way to create a paintbrush effect, to underline, accentuate, add some color and the handwritten markers were just the things. Very easy to use, easy to size, change the color. It was an affordable, perfect solution and I'm happy to recommend it.
Anonymous, US
The crisp, clean look of the graphics, and the fact that it allowed me to easily edit and change the colors to match the template was my main reason for purchasing them.
Brandie Jenkins, E-learning Developer, USA
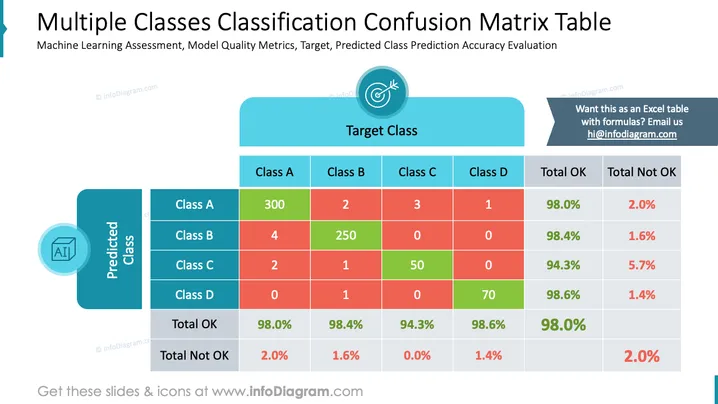
Diese PowerPoint-Folie präsentiert eine Verwirrungsmatrix zur Bewertung der Leistung eines maschinellen Lernklassifikationsmodells über mehrere Klassen (A, B, C, D). Sie enthält Vorhersagen im Vergleich zu den erwarteten Zielklassenresultaten, wobei korrekte Vorhersagen grün und inkorrekte rot hervorgehoben sind. Prozentsätze korrekter (Insgesamt OK) und inkorrekter (Insgesamt Nicht OK) Vorhersagen werden für jede Klasse angezeigt. Die Verwirrungsmatrix ist so strukturiert, dass sie angibt, wie oft das Modell eine Klasse korrekt oder inkorrekt vorhersagt, was entscheidend für das Verständnis seiner Genauigkeit ist.
Die Folie kombiniert eine Mischung aus Text, Farben und grafischen Elementen, um Daten klar und visuell unterscheidbar darzustellen. Der Kontrast zwischen grün und rot kommuniziert sofort korrekte und inkorrekte Vorhersagen, was hilft, die Leistung des Modells schnell zu beurteilen.


