

Your graphics add a nice touch to my presentations and I recently used them for one of my all-hands meetings. Your toolbox adds professionalism to my slides. Instead of using standard clipart.
Claude Jones, Director of Engineer, @Walmartlabs, USA

Your graphics add a nice touch to my presentations and I recently used them for one of my all-hands meetings. Your toolbox adds professionalism to my slides. Instead of using standard clipart.
Claude Jones, Director of Engineer, @Walmartlabs, USA
I needed a fresh look at some of my slides. I've tried to find a way to create a paintbrush effect, to underline, accentuate, add some color and the handwritten markers were just the things. Very easy to use, easy to size, change the color. It was an affordable, perfect solution and I'm happy to recommend it.
Anonymous, US
The crisp, clean look of the graphics, and the fact that it allowed me to easily edit and change the colors to match the template was my main reason for purchasing them.
Brandie Jenkins, E-learning Developer, USA
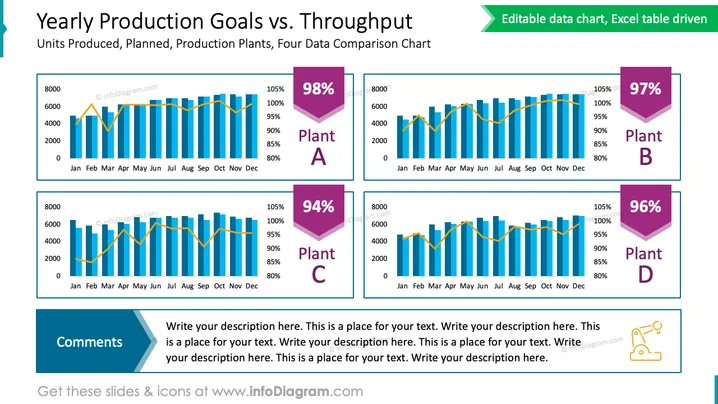
Die Folie bietet eine vergleichende Analyse der Produktionsziele gegen den tatsächlichen Durchsatz für vier verschiedenen Produktionsanlagen, bezeichnet als Anlage A, Anlage B, Anlage C und Anlage D. Die Daten jeder Anlage werden in einer Kombination aus Balken- und Liniendiagrammen über einen Zeitraum von 12 Monaten präsentiert, wobei der Prozentsatz der erreichten Ziele prominent darüber in einem farbigen Sechseck neben jedem Diagramm angezeigt wird. Anlage A erreichte 98 %, während Anlage B, Anlage C und Anlage D 97 %, 94 % und 96 % ihrer Produktionsziele erreichten, respektiv. Unter diesen Diagrammen befindet sich ein Abschnitt mit dem Titel "Kommentare" für weitere Beobachtungen oder Erklärungen.
Die Folie ist farbenfroh, mit einer kontrastierenden Farbpalette, die hilft, Datenpunkte zu unterscheiden. Das Format ist sauber und effizient und ermöglicht eine einfache Interpretation von komplexen Daten.



