Your graphics add a nice touch to my presentations and I recently used them for one of my all-hands meetings. Your toolbox adds professionalism to my slides. Instead of using standard clipart.
Claude Jones, Director of Engineer, @Walmartlabs, USA
Your graphics add a nice touch to my presentations and I recently used them for one of my all-hands meetings. Your toolbox adds professionalism to my slides. Instead of using standard clipart.
Claude Jones, Director of Engineer, @Walmartlabs, USA
I needed a fresh look at some of my slides. I've tried to find a way to create a paintbrush effect, to underline, accentuate, add some color and the handwritten markers were just the things. Very easy to use, easy to size, change the color. It was an affordable, perfect solution and I'm happy to recommend it.
Anonymous, US
The crisp, clean look of the graphics, and the fact that it allowed me to easily edit and change the colors to match the template was my main reason for purchasing them.
Brandie Jenkins, E-learning Developer, USA
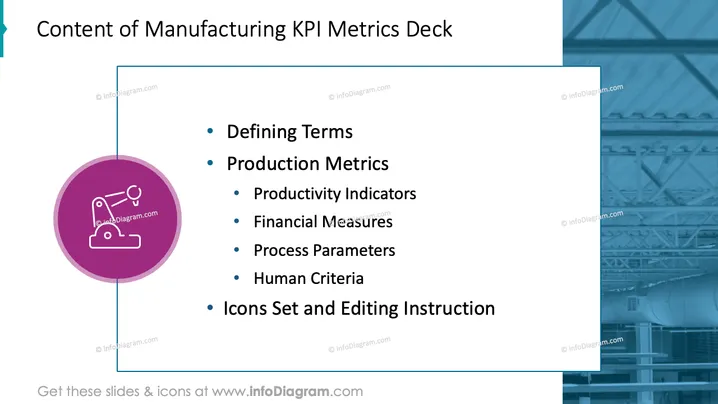
Die Folie ist ein Inhaltsverzeichnis für eine Präsentation zu KPI-Metriken in der Produktion, das die verschiedenen Abschnitte detailliert, die in der Präsentation behandelt werden. Es enthält 'Begriffsdefinitionen', um zentrale Konzepte zu klären, 'Produktionsmetriken', unterteilt in 'Produktivitätsindikatoren' (Maßnahmen zur Ausgabeneffizienz), 'Finanzkennzahlen' (monetäre Leistungsmetriken), 'Prozessparameter' (betriebliche Variablen) und 'Menschliche Kriterien' (arbeitsbezogene Metriken). Schließlich listet es bereits einen Abschnitt 'Ikonensatz und Bearbeitungsanweisung' auf, der möglicherweise Hinweise gibt, wie man Icons innerhalb der Präsentation verwenden und ändern kann.
Die Folie hat ein professionelles Erscheinungsbild mit einer klaren Trennung zwischen Titel und Inhalt, wobei Farbkontraste und Layoutdesign für eine einfache Lesbarkeit genutzt werden.


