Your graphics add a nice touch to my presentations and I recently used them for one of my all-hands meetings. Your toolbox adds professionalism to my slides. Instead of using standard clipart.
Claude Jones, Director of Engineer, @Walmartlabs, USA
Your graphics add a nice touch to my presentations and I recently used them for one of my all-hands meetings. Your toolbox adds professionalism to my slides. Instead of using standard clipart.
Claude Jones, Director of Engineer, @Walmartlabs, USA
I needed a fresh look at some of my slides. I've tried to find a way to create a paintbrush effect, to underline, accentuate, add some color and the handwritten markers were just the things. Very easy to use, easy to size, change the color. It was an affordable, perfect solution and I'm happy to recommend it.
Anonymous, US
The crisp, clean look of the graphics, and the fact that it allowed me to easily edit and change the colors to match the template was my main reason for purchasing them.
Brandie Jenkins, E-learning Developer, USA
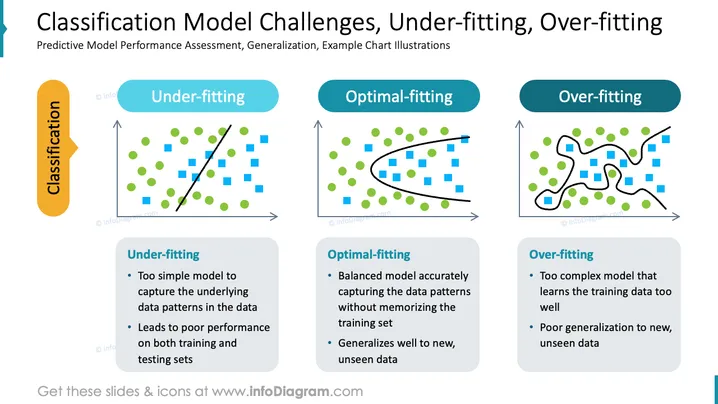
Die PowerPoint-Folie konzentriert sich auf die Herausforderungen von Klassifikationsmodellen im maschinellen Lernen, betont die Bewertung der Leistung prädiktiver Modelle und die Verallgemeinerung mit Beispieldiagramm-Illustrationen. Unteranpassung wird als ein zu einfaches Modell beschrieben, das es versäumt, die zugrunde liegenden Datenmuster zu erfassen, was zu einer schlechten Leistung bei Trainings- und Testdatensätzen führt. Optimalanpassung steht für ein gut ausgewogenes Modell, das Datenmuster genau erfasst und effektiv auf neue Daten verallgemeinert. Überanpassung ist durch ein zu kompliziertes Modell gekennzeichnet, das die Trainingsdaten übermäßig lernt und nicht in der Lage ist, auf unbekannte Daten zu verallgemeinern.
Der Gesamteindruck der Folie ist sauber, gut organisiert und nutzt visuelle Hilfsmittel wie Diagramme, farbcodierte Banner und Aufzählungspunkte, um komplexe statistische Konzepte einfach und effektiv zu vermitteln.


