Your graphics add a nice touch to my presentations and I recently used them for one of my all-hands meetings. Your toolbox adds professionalism to my slides. Instead of using standard clipart.
Claude Jones, Director of Engineer, @Walmartlabs, USA
Your graphics add a nice touch to my presentations and I recently used them for one of my all-hands meetings. Your toolbox adds professionalism to my slides. Instead of using standard clipart.
Claude Jones, Director of Engineer, @Walmartlabs, USA
I needed a fresh look at some of my slides. I've tried to find a way to create a paintbrush effect, to underline, accentuate, add some color and the handwritten markers were just the things. Very easy to use, easy to size, change the color. It was an affordable, perfect solution and I'm happy to recommend it.
Anonymous, US
The crisp, clean look of the graphics, and the fact that it allowed me to easily edit and change the colors to match the template was my main reason for purchasing them.
Brandie Jenkins, E-learning Developer, USA
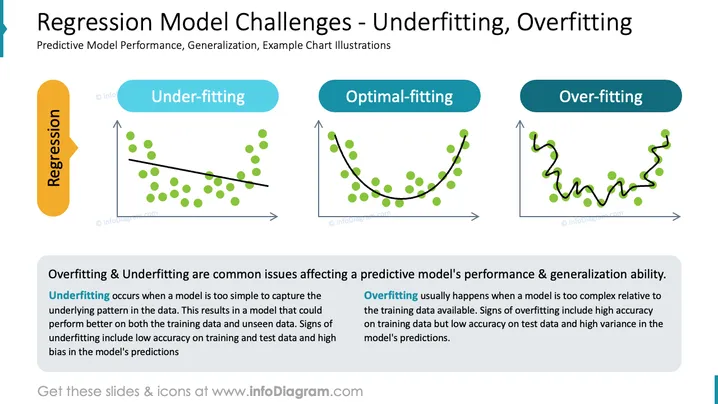
Diese PowerPoint-Folie behandelt die Herausforderungen im Regressionsmodell, die mit Unteranpassung und Überanpassung zusammenhängen. Unteranpassung bedeutet die Einfachheit eines Modells und seine Unfähigkeit, die zugrunde liegenden Muster in den Daten zu erfassen, was zu schlechter Leistung und hoher Verzerrung führt. Optimalanpassung stellt ein Gleichgewicht dar, bei dem ein Modell den tatsächlichen Trend genau erfasst. Überanpassung hebt die Komplexität der Anpassung eines Modells an den Lärm in den Daten hervor, was zu hoher Genauigkeit bei den Trainingsdaten, aber zu schlechter Verallgemeinerung auf neue, nicht gesehene Daten führt und damit eine hohe Varianz demonstriert.


