Your graphics add a nice touch to my presentations and I recently used them for one of my all-hands meetings. Your toolbox adds professionalism to my slides. Instead of using standard clipart.
Claude Jones, Director of Engineer, @Walmartlabs, USA
Your graphics add a nice touch to my presentations and I recently used them for one of my all-hands meetings. Your toolbox adds professionalism to my slides. Instead of using standard clipart.
Claude Jones, Director of Engineer, @Walmartlabs, USA
I needed a fresh look at some of my slides. I've tried to find a way to create a paintbrush effect, to underline, accentuate, add some color and the handwritten markers were just the things. Very easy to use, easy to size, change the color. It was an affordable, perfect solution and I'm happy to recommend it.
Anonymous, US
The crisp, clean look of the graphics, and the fact that it allowed me to easily edit and change the colors to match the template was my main reason for purchasing them.
Brandie Jenkins, E-learning Developer, USA
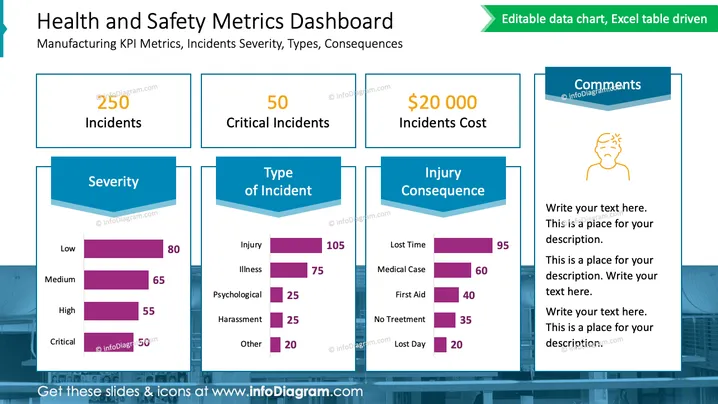
Diese PowerPoint-Folie mit dem Titel "Dashboard für Gesundheits- und Sicherheitskennzahlen" präsentiert eine Zusammenfassung der wichtigsten Leistungskennzahlen (KPIs) für Gesundheit und Sicherheit in der Fertigung. Sie enthält Kennzahlen zur Gesamtzahl der Vorfälle (250), kritischen Vorfällen (50) und den Kosten, die mit diesen Vorfällen verbunden sind (20.000 $). Zusätzlich bietet sie eine Aufschlüsselung der Vorfälle nach Schweregrad (Niedrig, Mittel, Hoch, Kritisch), Art (Verletzung, Krankheit, Psychisch, Belästigung, Sonstiges) und Folge (Verlorene Zeit, Medizinischer Fall, Erste Hilfe, Keine Behandlung, Verlorener Tag). Jede dieser Kennzahlen wird durch ein horizontales Balkendiagramm dargestellt, wobei verschiedene Schattierungen von Lila die Zählungen jeder Kategorie anzeigen.


