Your graphics add a nice touch to my presentations and I recently used them for one of my all-hands meetings. Your toolbox adds professionalism to my slides. Instead of using standard clipart.
Claude Jones, Director of Engineer, @Walmartlabs, USA
Your graphics add a nice touch to my presentations and I recently used them for one of my all-hands meetings. Your toolbox adds professionalism to my slides. Instead of using standard clipart.
Claude Jones, Director of Engineer, @Walmartlabs, USA
I needed a fresh look at some of my slides. I've tried to find a way to create a paintbrush effect, to underline, accentuate, add some color and the handwritten markers were just the things. Very easy to use, easy to size, change the color. It was an affordable, perfect solution and I'm happy to recommend it.
Anonymous, US
The crisp, clean look of the graphics, and the fact that it allowed me to easily edit and change the colors to match the template was my main reason for purchasing them.
Brandie Jenkins, E-learning Developer, USA
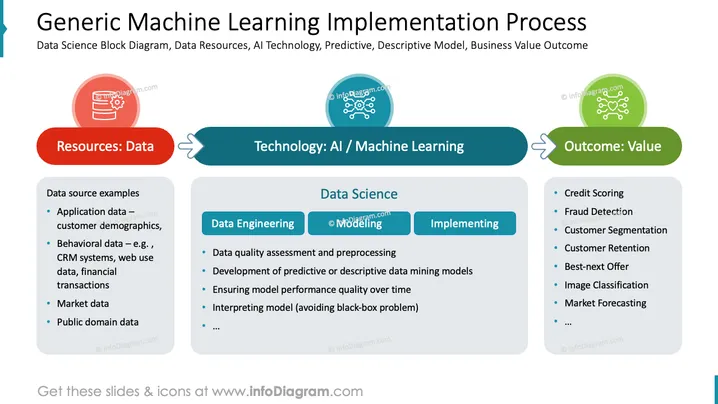
Die Folie scheint einen Überblick über ein maschinelles Lernprojekt von Anfang bis Ende zu geben. "Ressourcen: Daten" kennzeichnet die Anfangsphase und betont die Bedeutung der Datenerfassung, einschließlich Anwendungsdaten, Verhaltensdaten aus CRM-Systemen, Marktdaten und Daten aus dem öffentlichen Sektor. "Technologie: KI / Maschinelles Lernen" repräsentiert die angewandte Kernmethodologie, die Datenengineering umfasst, wie z.B. die Bewertung der Datenqualität, sowie das Modellieren, was die Entwicklung von prädiktiven Modellen und die Gewährleistung ihrer Leistungsfähigkeit über die Zeit beinhaltet. Schließlich skizziert "Ergebnis: Wert" potenzielle Ergebnisse wie Kreditbewertung, Betrugserkennung, Kundensegmentierung und Marktprognosen, die den greifbaren Wert demonstrieren, der durch die Implementierung dieser Technologien entsteht.


