Your graphics add a nice touch to my presentations and I recently used them for one of my all-hands meetings. Your toolbox adds professionalism to my slides. Instead of using standard clipart.
Claude Jones, Director of Engineer, @Walmartlabs, USA
Your graphics add a nice touch to my presentations and I recently used them for one of my all-hands meetings. Your toolbox adds professionalism to my slides. Instead of using standard clipart.
Claude Jones, Director of Engineer, @Walmartlabs, USA
I needed a fresh look at some of my slides. I've tried to find a way to create a paintbrush effect, to underline, accentuate, add some color and the handwritten markers were just the things. Very easy to use, easy to size, change the color. It was an affordable, perfect solution and I'm happy to recommend it.
Anonymous, US
The crisp, clean look of the graphics, and the fact that it allowed me to easily edit and change the colors to match the template was my main reason for purchasing them.
Brandie Jenkins, E-learning Developer, USA
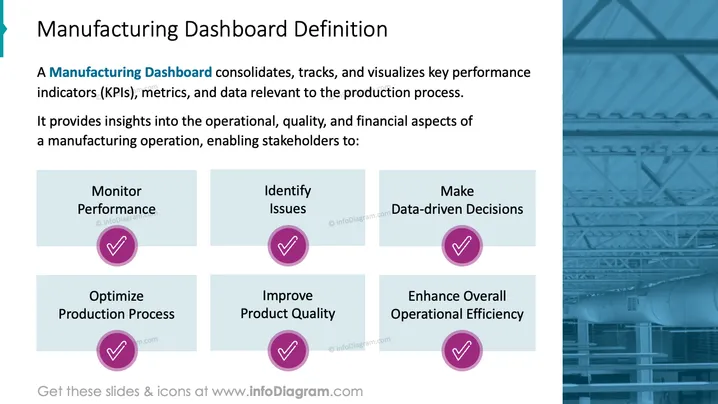
Die Folie mit dem Titel "Definition des Fertigungs-Dashboards" erläutert, wie ein Fertigungs-Dashboard wichtige Leistungsindikatoren (KPIs), Metriken und Daten, die für den Produktionsprozess relevant sind, konsolidiert, verfolgt und visualisiert. Es wird deutlich, dass ein solches Dashboard nützlich ist, um Einblicke in betriebliche, qualitative und finanzielle Aspekte eines Fertigungsbetriebs zu gewinnen. Diese Einblicke ermächtigen die Stakeholder, sechs zentrale Maßnahmen zu ergreifen: Leistung überwachen, Probleme identifizieren, datenbasierte Entscheidungen treffen, den Produktionsprozess optimieren, die Produktqualität verbessern und die allgemeine betriebliche Effizienz steigern. Jede dieser Maßnahmen ist entscheidend für die Aufrechterhaltung und Verbesserung der Effektivität eines Fertigungsbetriebs.


