

Your graphics add a nice touch to my presentations and I recently used them for one of my all-hands meetings. Your toolbox adds professionalism to my slides. Instead of using standard clipart.
Claude Jones, Director of Engineer, @Walmartlabs, USA

Your graphics add a nice touch to my presentations and I recently used them for one of my all-hands meetings. Your toolbox adds professionalism to my slides. Instead of using standard clipart.
Claude Jones, Director of Engineer, @Walmartlabs, USA
I needed a fresh look at some of my slides. I've tried to find a way to create a paintbrush effect, to underline, accentuate, add some color and the handwritten markers were just the things. Very easy to use, easy to size, change the color. It was an affordable, perfect solution and I'm happy to recommend it.
Anonymous, US
The crisp, clean look of the graphics, and the fact that it allowed me to easily edit and change the colors to match the template was my main reason for purchasing them.
Brandie Jenkins, E-learning Developer, USA
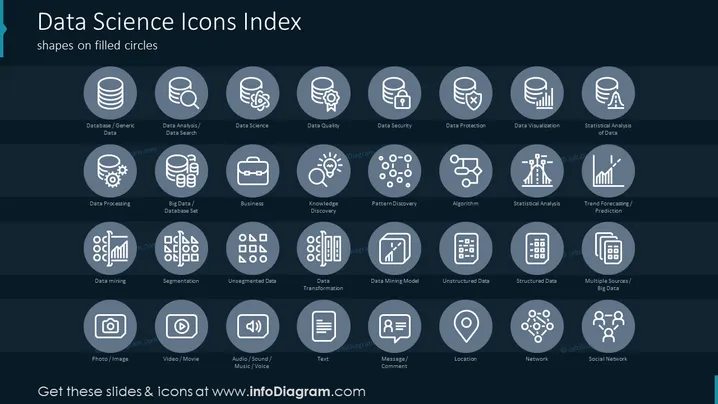
Die PowerPoint-Folie mit dem Titel "Index der Data Science-Icons" präsentiert eine Reihe von Icons, die mit verschiedenen Data Science-Konzepten verbunden sind, wobei jedes innerhalb eines ausgefüllten Kreises dargestellt wird. Es gibt Icons für "Datenbank / Generische Daten", die das allgemeine Konzept von Datenbanken anzeigen; "Datenanalyse / Datensuche", das den Prozess des Examens von Datensätzen zur Gewinnung von Erkenntnissen signifies; "Datenqualität", das sich auf die Genauigkeit und Zuverlässigkeit von Daten konzentriert; "Datensicherheit", das die Maßnahmen zum Schutz von Daten vor unbefugtem Zugriff oder Korruption hervorhebt; "Datenschutz", das sich auf den Schutz persönlicher oder sensibler Daten bezieht; und "Datenvisualisierung", das die Darstellung von Daten in visuellen Formaten wie Diagrammen oder Grafiken verdeutlicht. Andere Icons repräsentieren spezialisierte Bereiche wie "Big Data / Datenbank-Set", "Geschäft", "Wissensentdeckung", "Musterentdeckung", "Algorithmus", "Statistische Analyse" und "Trendprognose / Vorhersage", die alle für Data Science von wesentlicher Bedeutung sind.
Die Folie hat ein modernes und professionelles Aussehen mit einem konsistenten Farbschema, das Klarheit und Lesbarkeit betont und sie für eine geschäftliche oder akademische Umgebung geeignet macht.



