

Your graphics add a nice touch to my presentations and I recently used them for one of my all-hands meetings. Your toolbox adds professionalism to my slides. Instead of using standard clipart.
Claude Jones, Director of Engineer, @Walmartlabs, USA

Your graphics add a nice touch to my presentations and I recently used them for one of my all-hands meetings. Your toolbox adds professionalism to my slides. Instead of using standard clipart.
Claude Jones, Director of Engineer, @Walmartlabs, USA
I needed a fresh look at some of my slides. I've tried to find a way to create a paintbrush effect, to underline, accentuate, add some color and the handwritten markers were just the things. Very easy to use, easy to size, change the color. It was an affordable, perfect solution and I'm happy to recommend it.
Anonymous, US
The crisp, clean look of the graphics, and the fact that it allowed me to easily edit and change the colors to match the template was my main reason for purchasing them.
Brandie Jenkins, E-learning Developer, USA
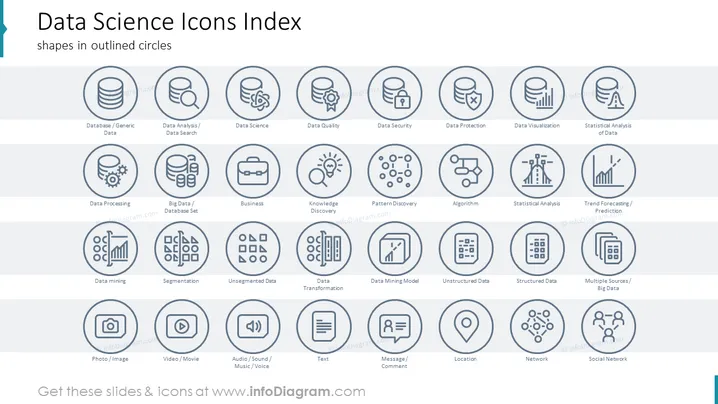
Die Folie mit dem Titel "Index der Data Science Icons" listet eine Vielzahl von datenbezogenen Konzepten auf, die durch stilisierte Icons in umrandeten Kreisen dargestellt werden. Jeder Kreis enthält ein Icon und ein Label darunter, das das Konzept beschreibt, das es darstellt. Die Icons verkörpern Themen wie 'Datenbank/allgemeine Daten', 'Datenanalyse/Datensuche', 'Data Science' und erweitern sich um 'Datenqualität', 'Datensicherheit', 'Datenschutz' und 'Datenvisualisierung'. Weitere bemerkenswerte Konzepte sind 'Datenmining', 'Segmentierung', 'nicht segmentierte Daten', 'Datenumwandlung', 'Datenmining-Modell', 'unstrukturierte Daten', 'strukturierte Daten', 'multiple Quellen/große Daten' und reichen sogar bis zu Medientypen wie 'Foto/Bild', 'Video/Film', 'Audio/Ton', 'Text', 'Nachricht/Kommentar', 'Standort', 'Netzwerk' und 'Soziales Netzwerk', wodurch eine umfassende Darstellung der verschiedenen Elemente im Zusammenhang mit Data Science-Projekten geboten wird.
Der Gesamteindruck der Folie ist professionell und organisiert, wobei auf die Verwendung von Ikonografie zur Vermittlung von Data Science-Konzepten gesetzt wird. Das visuelle Layout ist unkompliziert und konzentriert sich auf Klarheit und einfache Interpretation.



