Your graphics add a nice touch to my presentations and I recently used them for one of my all-hands meetings. Your toolbox adds professionalism to my slides. Instead of using standard clipart.
Claude Jones, Director of Engineer, @Walmartlabs, USA
Your graphics add a nice touch to my presentations and I recently used them for one of my all-hands meetings. Your toolbox adds professionalism to my slides. Instead of using standard clipart.
Claude Jones, Director of Engineer, @Walmartlabs, USA
I needed a fresh look at some of my slides. I've tried to find a way to create a paintbrush effect, to underline, accentuate, add some color and the handwritten markers were just the things. Very easy to use, easy to size, change the color. It was an affordable, perfect solution and I'm happy to recommend it.
Anonymous, US
The crisp, clean look of the graphics, and the fact that it allowed me to easily edit and change the colors to match the template was my main reason for purchasing them.
Brandie Jenkins, E-learning Developer, USA
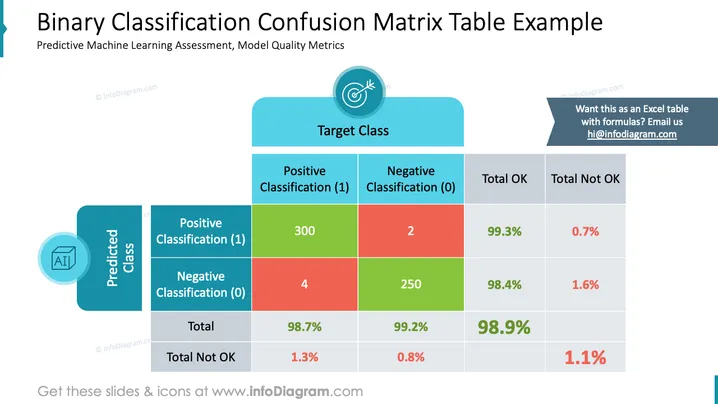
Diese PowerPoint-Folie präsentiert eine "Verwirrungsmatrix-Tabelle", die zur Bewertung der Leistung eines binären Klassifikationsalgorithmus verwendet wird, und ist Teil der Bewertungen von prädiktiven Machine-Learning-Modellen. Die Matrix umfasst Kategorien wie Wahre Positive (300 Instanzen), Wahre Negative (250 Instanzen), Falsche Positive (2 Instanzen) und Falsche Negative (4 Instanzen), zusammen mit berechneten Prozentsätzen für jede Kategorie, die die Modellgenauigkeit, die Fehlklassifizierungsrate und andere Qualitätsmetriken anzeigen.
Die Folie ist im professionellen und Unternehmensstil gestaltet, wobei eine farbcodierte Matrix verwendet wird, um verschiedene Aspekte der Modellvalidierung zu kennzeichnen. Das Design erleichtert ein klares Verständnis der Modellgenauigkeit und der Fehlerquoten durch visuelle Trennung und Farbunterscheidung verschiedener Metriken.


