

Your graphics add a nice touch to my presentations and I recently used them for one of my all-hands meetings. Your toolbox adds professionalism to my slides. Instead of using standard clipart.
Claude Jones, Director of Engineer, @Walmartlabs, USA

Your graphics add a nice touch to my presentations and I recently used them for one of my all-hands meetings. Your toolbox adds professionalism to my slides. Instead of using standard clipart.
Claude Jones, Director of Engineer, @Walmartlabs, USA
I needed a fresh look at some of my slides. I've tried to find a way to create a paintbrush effect, to underline, accentuate, add some color and the handwritten markers were just the things. Very easy to use, easy to size, change the color. It was an affordable, perfect solution and I'm happy to recommend it.
Anonymous, US
The crisp, clean look of the graphics, and the fact that it allowed me to easily edit and change the colors to match the template was my main reason for purchasing them.
Brandie Jenkins, E-learning Developer, USA
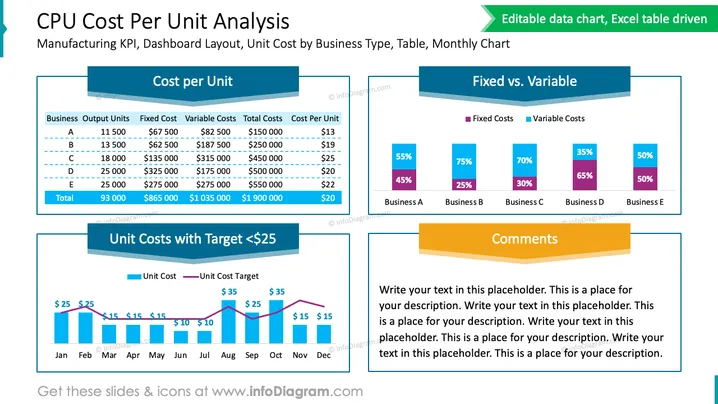
Die Folie mit dem Titel "Analyse der CPU-Kosten pro Einheit" ist mit mehreren grafischen und textlichen Komponenten strukturiert, um wichtige Leistungskennzahlen (KPIs) der Fertigung, ein Dashboard-Layout und die Kosten pro Einheit nach Geschäftstyp zu reflektieren. Sie umfasst eine Tabelle, die die Produktionszahlen, Fixkosten, variable Kosten, Gesamtkosten und Kosten pro Einheit für die Geschäftstypen A bis E zusammenfasst. Ein Säulendiagramm zeigt die Stückkosten mit dem Ziel von 25 USD, während ein anderes Säulendiagramm die Fixkosten im Vergleich zu den variablen Kosten über die Unternehmen hinweg vergleicht. Ein Platzhalter für Kommentare steht ebenfalls zur Verfügung, um relevante Notizen hinzuzufügen.
Die Folie verwendet ein sauberes Layout und visuell unterscheidbare Abschnitte, um komplexe Daten in einem leicht verständlichen Format zu präsentieren. Der Farbkontrast und die klare Beschriftung unterstützen ein schnelles Verständnis der präsentierten Daten.



