

Your graphics add a nice touch to my presentations and I recently used them for one of my all-hands meetings. Your toolbox adds professionalism to my slides. Instead of using standard clipart.
Claude Jones, Director of Engineer, @Walmartlabs, USA

Your graphics add a nice touch to my presentations and I recently used them for one of my all-hands meetings. Your toolbox adds professionalism to my slides. Instead of using standard clipart.
Claude Jones, Director of Engineer, @Walmartlabs, USA
I needed a fresh look at some of my slides. I've tried to find a way to create a paintbrush effect, to underline, accentuate, add some color and the handwritten markers were just the things. Very easy to use, easy to size, change the color. It was an affordable, perfect solution and I'm happy to recommend it.
Anonymous, US
The crisp, clean look of the graphics, and the fact that it allowed me to easily edit and change the colors to match the template was my main reason for purchasing them.
Brandie Jenkins, E-learning Developer, USA
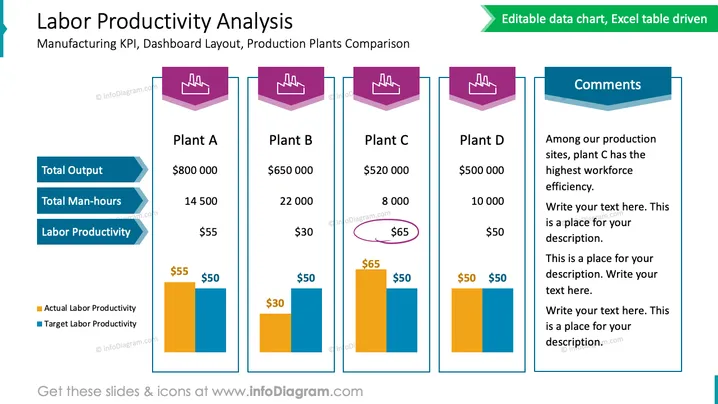
Die Folie mit dem Titel "Analyse der Arbeitsproduktivität" vergleicht die Leistung von vier Produktionsstätten (A, B, C und D) basierend auf den Fertigungskpis. Für jede Anlage werden drei Kennzahlen präsentiert: Gesamter Output, Gesamtarbeitsstunden und Arbeitsproduktivität, wobei letzteres sowohl in Ist- als auch in Zielwerten durch Balkendiagramme dargestellt wird. Außerdem gibt es einen Kommentarbereich für Anlage C, der darauf hinweist, dass sie die höchste Arbeitseffizienz aufweist, mit Platzhaltertext für weitere Ausführungen.
Die Folie ist ordentlich organisiert mit einer klaren Struktur, die den Vergleich über verschiedene Leistungsindikatoren erleichtert. Der Einsatz unterschiedlicher Farben für Ist- und Zielwerte bietet einen sofortigen visuellen Hinweis zur Leistungsbewertung.



