Your graphics add a nice touch to my presentations and I recently used them for one of my all-hands meetings. Your toolbox adds professionalism to my slides. Instead of using standard clipart.
Claude Jones, Director of Engineer, @Walmartlabs, USA
Your graphics add a nice touch to my presentations and I recently used them for one of my all-hands meetings. Your toolbox adds professionalism to my slides. Instead of using standard clipart.
Claude Jones, Director of Engineer, @Walmartlabs, USA
I needed a fresh look at some of my slides. I've tried to find a way to create a paintbrush effect, to underline, accentuate, add some color and the handwritten markers were just the things. Very easy to use, easy to size, change the color. It was an affordable, perfect solution and I'm happy to recommend it.
Anonymous, US
The crisp, clean look of the graphics, and the fact that it allowed me to easily edit and change the colors to match the template was my main reason for purchasing them.
Brandie Jenkins, E-learning Developer, USA
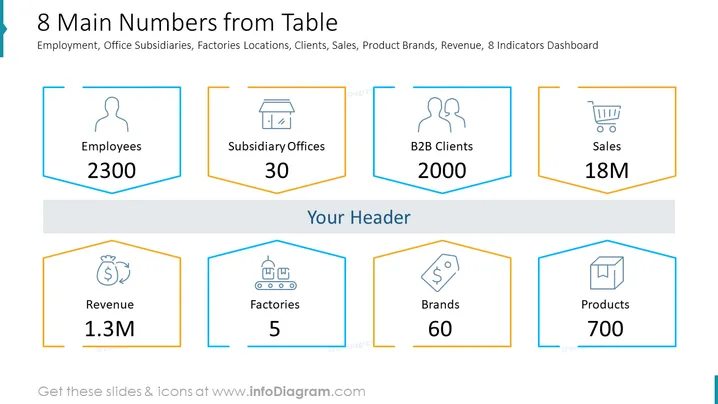
Diese PowerPoint-Folie trägt den Titel "8 Hauptzahlen aus der Tabelle" und befasst sich mit Geschäftszahlen wie Beschäftigung, Büros, Standorte von Fabriken, Kunden, Vertrieb, Produktmarken, Umsatz und zeigt ein Dashboard an. Sie beinhaltet numerische Werte, die mit Mitarbeitern (2300 beschäftigte Personen), Tochterbüros (30 Standorte), B2B-Kunden (2000 bediente Kunden) und Umsatz (18 Millionen in Währung) assoziiert sind. Zusätzlich wird ein Umsatz von 1,3 Millionen genannt, die Anzahl der Fabriken beträgt 5, Marken 60 und Produkte 700, die jeweils den Umfang und den Geltungsbereich der Geschäftstätigkeiten und der Marktpräsenz eines Unternehmens zeigen.
Der Gesamteindruck der Folie ist professionell, mit einem ausgewogenen Einsatz von Farbe und Weißraum, der einen leicht nachvollziehbaren Informationsfluss schafft. Die grafischen Elemente sind so gestaltet, dass sie visuell ansprechend sind und gleichzeitig die wichtigsten Kennzahlen effektiv kommunizieren.


