Financial Decks
Visualize your results with ease
USA global trade export routes shown on world map with arrows, pins and flags
from deck
Trade Finance Presentation Diagrams (PPT Template)
Info
USA Global Trade Export Routes Shown on World Map With Arrows, Pins and Flags Infographic
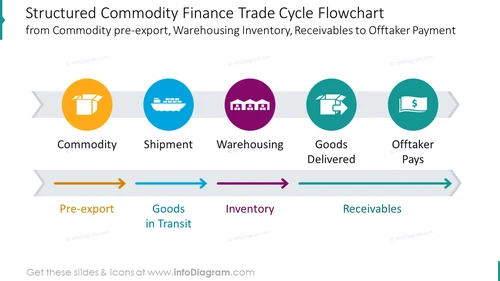
Use this PowerPoint structured flowchart to illustrate the trade flow of commodities, such as pre-export, goods in transit, inventory, and receivables. Symbolize with meaningful icons the following stages of the process: commodity, shipment, warehousing, goods delivered, and offtaker pays. Learn about trade finance on Wikipedia.
What Does This USA Global Trade Export Routes Shown on World Map With Arrows, Pins and Flags Infographic Include?
- 2 light grey arrow-shaped timelines
- colorful arrows representing flow between stages of the process
- colorful circles with titles and icons naming stages of the flowchart
- flat icons of a product, box, commodity, cargo ship, container ship, logistics, transportation, shipment, warehouse, goods delivered, product flow, money, cash, payment
This USA Global Trade Export Routes Shown on World Map With Arrows, Pins and Flags Infographic is a part of our Trade Finance Presentation Diagrams PPT Template.


