Variations: Blue Header and Total Row Focus Table Design
from deck
Creative Tables Graphics (PPT template)
- Info
- How To Edit
- Usage example
Info
Variations: Blue Header and Total Row Focus Table Design
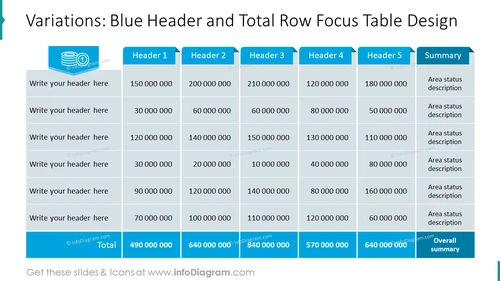
Slide Content: The slide features a table designed to showcase data with emphasis on the header and total row. The headers "Header 1" through "Header 5" suggest categorization of information along the top, with "Summary" pointing to additional details. Each row invites the viewer to insert descriptions or data points under the headers, with the bottom row indicating aggregated "Total" values, providing an overview of the numerical data and an "Overall summary" to encapsulate the findings. This format is structured to effectively communicate complex data in a visually-organized way.
Graphical Look:
- The slide title is set in large, bold, blue text at the top.
- A blue, ribbony banner icon sits to the left of the title, enhancing the design element.
- The table has a thick blue header row, indicating the importance of these categories.
- The first column is designed for textual input, with placeholder text "Write your header here".
- The main body of the table has alternating rows in two shades of light grey for easy reading.
- The "Total" row at the table's bottom is highlighted with a darker blue background, mirroring the header design.
- The "Summary" column on the right has a light blue background, distinguishing it from numerical data.
- The slide background is white, providing a stark contrast to the colored table elements.
The overall look of the slide is clean and professional, with a color scheme focused on shades of blue and grey that highlight key areas of the table. The design employs contrast to draw attention to the header and total rows, ensuring they are easily distinguishable.
Use Cases:
- Presenting financial results or budgetary overviews where category totals are a focal point.
- Summarizing sales data across different regions, products, or time periods during business meetings.
- Visualizing project milestones or status updates in a manner that highlights cumulative achievements.
- Reporting on key performanceindicators (KPIs) in a manner that makes comparative analysis across multiple parameters straightforward.
How To Edit
How to edit text & colors

How to expand / shorten diagram

How to Replace Icons in infoDiagram PPT


