Your graphics add a nice touch to my presentations and I recently used them for one of my all-hands meetings. Your toolbox adds professionalism to my slides. Instead of using standard clipart.
Claude Jones, Director of Engineer, @Walmartlabs, USA
Your graphics add a nice touch to my presentations and I recently used them for one of my all-hands meetings. Your toolbox adds professionalism to my slides. Instead of using standard clipart.
Claude Jones, Director of Engineer, @Walmartlabs, USA
I needed a fresh look at some of my slides. I've tried to find a way to create a paintbrush effect, to underline, accentuate, add some color and the handwritten markers were just the things. Very easy to use, easy to size, change the color. It was an affordable, perfect solution and I'm happy to recommend it.
Anonymous, US
The crisp, clean look of the graphics, and the fact that it allowed me to easily edit and change the colors to match the template was my main reason for purchasing them.
Brandie Jenkins, E-learning Developer, USA
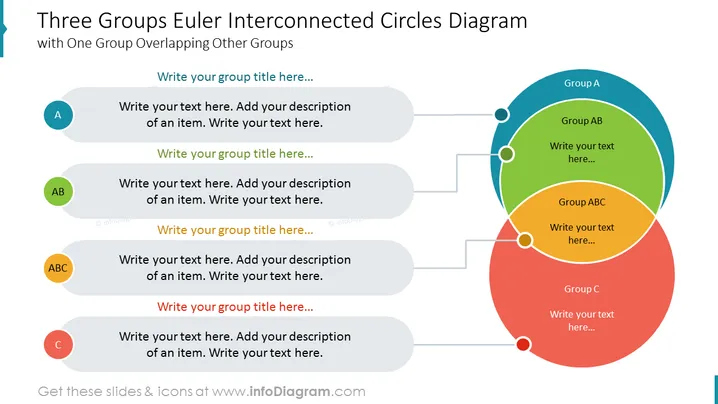
This PowerPoint slide, titled "Three Groups Euler Interconnected Circles Diagram", showcases a Venn diagram with three overlapping circles, each representing a unique group A, B, and C. In the intersections where these groups overlap, there are areas for groups AB and ABC, signifying shared characteristics or relationships. The slide has placeholders for the title of each group and accompanying descriptions, allowing the presenter to specify the nature of these groups and their interconnections.
The overall look of the slide is clean and modern, utilizing colors and shapes to distinctly convey the concept of interconnected groups. The layout provides a structured yet visually appealing way to dissect and explain relationships within a dataset or concept.


