Your graphics add a nice touch to my presentations and I recently used them for one of my all-hands meetings. Your toolbox adds professionalism to my slides. Instead of using standard clipart.
Claude Jones, Director of Engineer, @Walmartlabs, USA
Your graphics add a nice touch to my presentations and I recently used them for one of my all-hands meetings. Your toolbox adds professionalism to my slides. Instead of using standard clipart.
Claude Jones, Director of Engineer, @Walmartlabs, USA
I needed a fresh look at some of my slides. I've tried to find a way to create a paintbrush effect, to underline, accentuate, add some color and the handwritten markers were just the things. Very easy to use, easy to size, change the color. It was an affordable, perfect solution and I'm happy to recommend it.
Anonymous, US
The crisp, clean look of the graphics, and the fact that it allowed me to easily edit and change the colors to match the template was my main reason for purchasing them.
Brandie Jenkins, E-learning Developer, USA
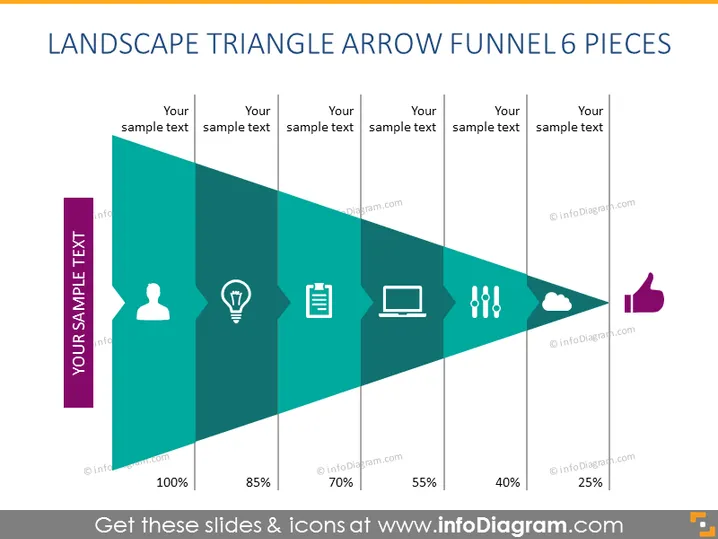
The slide depicts a funnel-shaped progression using a landscape triangle arrow with 6 distinct segments, signifying different stages or metrics that decrease from 100% to 25%. Each piece of the triangle is associated with a different icon and place for sample text, potentially representing a process step or a quantifiable metric in a sequence. The icons suggest personal user data, creativity or innovation, documentation, technology, analysis or metrics, and customer satisfaction or approval.
The slide has a structured, professional look, incorporating a clear, visual representation of a stepped process or data flow. The use of percentage values and icons within the segments of the funnel assists in conveying a quantitative journey toward a final outcome or evaluation.


