Your graphics add a nice touch to my presentations and I recently used them for one of my all-hands meetings. Your toolbox adds professionalism to my slides. Instead of using standard clipart.
Claude Jones, Director of Engineer, @Walmartlabs, USA
Your graphics add a nice touch to my presentations and I recently used them for one of my all-hands meetings. Your toolbox adds professionalism to my slides. Instead of using standard clipart.
Claude Jones, Director of Engineer, @Walmartlabs, USA
I needed a fresh look at some of my slides. I've tried to find a way to create a paintbrush effect, to underline, accentuate, add some color and the handwritten markers were just the things. Very easy to use, easy to size, change the color. It was an affordable, perfect solution and I'm happy to recommend it.
Anonymous, US
The crisp, clean look of the graphics, and the fact that it allowed me to easily edit and change the colors to match the template was my main reason for purchasing them.
Brandie Jenkins, E-learning Developer, USA
The PowerPoint slide is titled "Table Outline Icons Set — Money" and features a collection of line icons related to financial themes. Each icon represents a concept: Product (a box with a dollar sign, suggesting goods for sale), Box (plain box, perhaps for shipment or storage), Finance (a bag of money, representing financial transactions), Label (suggesting identification or branding), Price Tag (indicating cost), Turnover (a bag of money with an arrow, possibly representing revenue cycling), Costs (a calculator, signifying calculations of expenses), Discount (a tag with a percentage, showing price reduction), Percent (a symbol indicating a percentage), Sale (coin with dollar sign, denoting commerce), Coins (stack of coins, symbolizing currency), Dashboard (speedometer, illustrating measurement or analytics), Indicator (dial with pointer, representing a gauge of performance), and Shopping Cart (typical symbol for purchasing or e-commerce).
The slide delivers a professional and modern visual experience emphasizing clarity and simplicity. The use of light blue and grey tones against the white background provides a crisp, unob ## Table Outline Icons Set — Money
The PowerPoint slide is titled "Table Outline Icons Set — Money" and features a collection of line icons related to financial themes. Each icon represents a concept: Product (a box with a dollar sign, suggesting goods for sale), Box (plain box, perhaps for shipment or storage), Finance (a bag of money, representing financial transactions), Label (suggesting identification or branding), Price Tag (indicating cost), Turnover (a bag of money with an arrow, possibly representing revenue cycling), Costs (a calculator, signifying calculations of expenses), Discount (a tag with a percentage, showing price reduction), Percent (a symbol indicating a percentage), Sale (coin with dollar sign, denoting commerce), Coins (stack of coins, symbolizing currency), Dashboard (speedometer, illustrating measurement or analytics), Indicator (dial with pointer, representing a gauge of performance), and Shopping Cart (typical symbol for purchasing or e-commerce).
The slide delivers a professional and modern visual experience emphasizing clarity and simplicity. The use of light blue and grey tones against the white background provides a crisp, uncl ## Table Outline Icons Set — Money
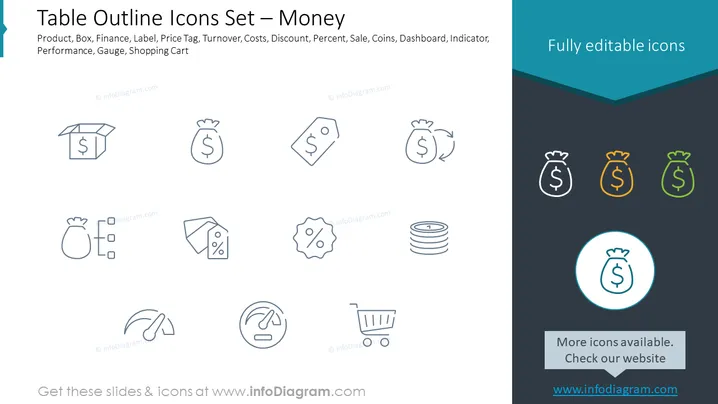
The PowerPoint slide is titled "Table Outline Icons Set — Money" and showcases a variety of financial-themed icons. These icons represent various financial and monetary concepts: Product indicates items for sale, Box suggests shipping or storage, Finance symbolizes financial activities, Label may refer to branding or information tagging, Price Tag denotes the cost of an item, Turnover relates to the movement or cycle of funds, Costs highlight the aspect of expenditure, Discount implies a reduction in price, Percent shows proportions in deals or statistics, Sale is linked to commercial transactions, Coins denote money in metal currency form, Dashboard symbolizes data analysis or performance measurement, Indicator could point to different types of metrics, and Shopping Cart symbolizes purchasing or e-commerce activities.
The slide is designed with a professional and clean aesthetic. It uses a limited color palette, focusing on dark blue, light blue, and grey to create a harmonious and visually appealing layout.
The PowerPoint slide is titled "Table Outline Icons Set — Money" and showcases a collection of financial-themed icons. Each icon conveys a specific concept: a Product box implies something for sale, a finance Money Bag stands for financial transactions, a Price Tag relates to pricing, a Turnover icon might refer to sales or inventory cycles, a Calculator symbolizes Costs, a Discount Price Tag suggests a reduction, a Percent sign is self-explanatory, a Coin icon denotes money, a Dashboard implies performance tracking, an Indicator could mean measurement, and a Shopping Cart icon is commonly used for purchasing.
The slide's design is crisp and clear, with an emphasis on simplicity and readability. The contrasting blue header and footer emphasize the content area where the icons are presented, which adhere to a consistent style for ease of interpretation.


