Your graphics add a nice touch to my presentations and I recently used them for one of my all-hands meetings. Your toolbox adds professionalism to my slides. Instead of using standard clipart.
Claude Jones, Director of Engineer, @Walmartlabs, USA
Your graphics add a nice touch to my presentations and I recently used them for one of my all-hands meetings. Your toolbox adds professionalism to my slides. Instead of using standard clipart.
Claude Jones, Director of Engineer, @Walmartlabs, USA
I needed a fresh look at some of my slides. I've tried to find a way to create a paintbrush effect, to underline, accentuate, add some color and the handwritten markers were just the things. Very easy to use, easy to size, change the color. It was an affordable, perfect solution and I'm happy to recommend it.
Anonymous, US
The crisp, clean look of the graphics, and the fact that it allowed me to easily edit and change the colors to match the template was my main reason for purchasing them.
Brandie Jenkins, E-learning Developer, USA
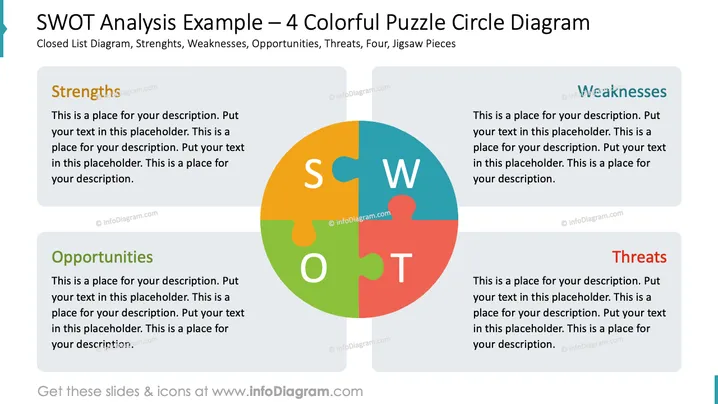
This PowerPoint slide is titled "SWOT Analysis Example – 4 Colorful Puzzle Circle Diagram" and it is designed to present a SWOT analysis using a puzzle diagram. SWOT stands for Strengths, Weaknesses, Opportunities, and Threats, and this slide has placeholders for each of these elements. Strengths and Weaknesses are often internal factors within an organization, while Opportunities and Threats typically describe external factors that can affect the organization's performance. The slide offers a visual representation of how these four elements are interlocked, like pieces of a puzzle, indicating their interconnected nature in strategic planning.
The overall look of the slide is clean and professional with a compelling visual element that intuitively conveys the concept of interconnectedness. The color-coding and placement of text boxes reinforce the distinctions between the elements of SWOT.


