Your graphics add a nice touch to my presentations and I recently used them for one of my all-hands meetings. Your toolbox adds professionalism to my slides. Instead of using standard clipart.
Claude Jones, Director of Engineer, @Walmartlabs, USA
Your graphics add a nice touch to my presentations and I recently used them for one of my all-hands meetings. Your toolbox adds professionalism to my slides. Instead of using standard clipart.
Claude Jones, Director of Engineer, @Walmartlabs, USA
I needed a fresh look at some of my slides. I've tried to find a way to create a paintbrush effect, to underline, accentuate, add some color and the handwritten markers were just the things. Very easy to use, easy to size, change the color. It was an affordable, perfect solution and I'm happy to recommend it.
Anonymous, US
The crisp, clean look of the graphics, and the fact that it allowed me to easily edit and change the colors to match the template was my main reason for purchasing them.
Brandie Jenkins, E-learning Developer, USA
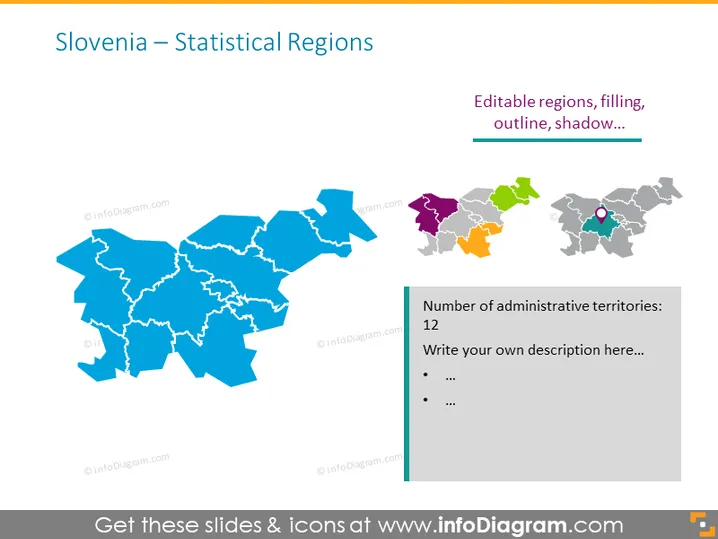
The slide presents an overview of Slovenia's statistical regions, featuring a main map with editable regions, indicating the possibility to change their filling, outline, and shadow, alluding to a customizable illustration for presentations. A small sidebar mentions there are 12 administrative territories without further details, inviting the presenter to add their own description relevant to the presentation's context.
The overall look of the slide is modern and professional, with a color scheme that highlights the main content effectively. The visual layout is balanced, with the maps serving as the focal points.


