Financial Decks
Visualize your results with ease
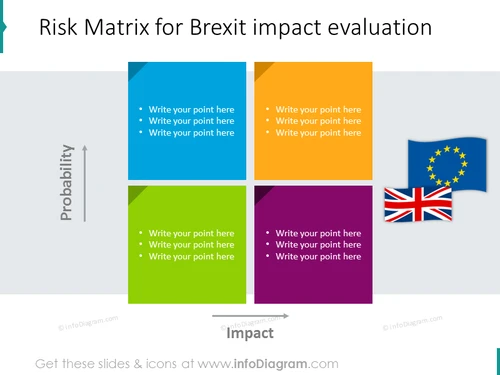
Risk matrix for Brexit impact shown with matrix diagram
from deck
Brexit Impact Presentation & UK-EU economy facts (PPT Template)
Info
Risk Matrix for Brexit impact evaluation
Slide Content
The PowerPoint slide presents a Risk Matrix for evaluating the potential impact of Brexit. It features a two-dimensional grid with "Probability" on the y-axis and "Impact" on the x-axis, creating four quadrants with different colors: blue, yellow, green, and purple. Each quadrant contains placeholder text for points to be added. The color-coded quadrants would represent the level of risk associated with Brexit—blue for low probability/low impact to purple for high probability/high impact.
Graphical Look
- A large title in bold at the top of the slide reads "Risk Matrix for Brexit impact evaluation."
- Four colored quadrants divide the slide, with hues of blue, yellow, green, and purple.
- The y-axis is labeled "Probability" with an upward arrow.
- The x-axis is labeled "Impact" with an arrow pointing to the right.
- Each quadrant contains three bullet points with placeholder text: "Write your point here."
- In the top right corner, there are icons of the EU flag and the UK flag, representing Brexit.
The slide is clean and visually balanced, using color coding to differentiate the levels of risk. The strategic placement of the EU and UK flags in the slide's corner provides a clear context for the topic.
Use Cases
- To assess and discuss the risks associated with Brexit in a business strategy meeting.
- For presenting to stakeholders to inform them about potential Brexit-related scenarios and their implications.
- For risk management workshops, to identify and categorize potential challenges a company may face due to Brexit.
- During planning sessions to prioritize actions based on the risks detailed in each quadrant.


