Resources, energy & agriculture + Public sector, science & culture index of icons— basic shapes
Slide Content
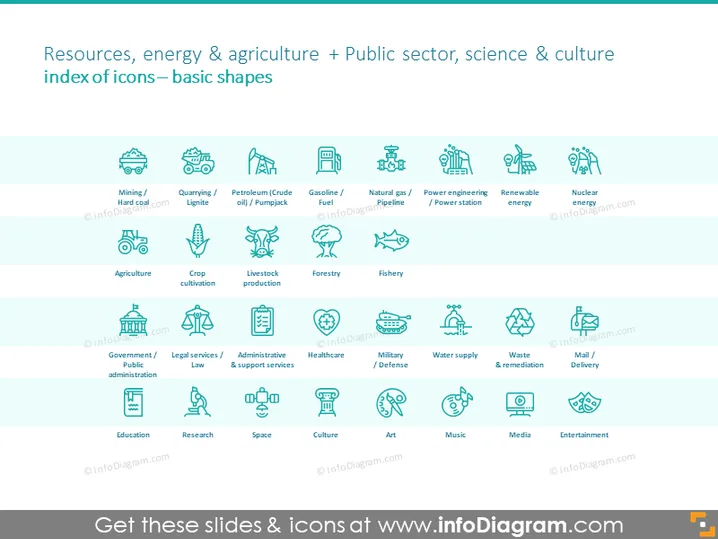
The PowerPoint slide titled "Resources, energy & agriculture + Public sector, science & culture index of icons— basic shapes" appears to be a comprehensive collection of stylized icons organized into several categories. Each category represents different sectors like Mining/Hard coal, Quarrying/Lignite, Petroleum/Crude oil, Gasoline/Fuel, Natural gas/Pipeline, Power engineering, Renewable energy, Nuclear energy, Agriculture, Crop cultivation, Livestock production, Forestry, Fishery, Government/Public administration, Legal services/Law, Administrative & support services, Healthcare, Military/Defense, Water supply, Waste & remediation, Mail/Delivery, Education, Research, Space, Culture, Art, Music, Media, and Entertainment. Each category could be related to a specific industry or sector, indicating a wide array of fields where such icons may be useful for visual representation.
Graphical Look
- The slide background is white with a grid of icons and text labels in a lighter shade of blue.
- Each icon is distinct and styled in a simple, line-art design.
- The icons are organized into six rows, with a total of five columns, aligned horizontally and vertically to form a grid.
- Below each icon, there is a corresponding label that describes the represented concept or industry.
- The icons depict a variety of subjects, such as energy sources, agriculture, public services, science, and culture.
- The font used for the text is sans-serif, which complements the clean and modern design of the icons.
- There is a variation in the icon shapes, some are enclosed in circles, hexagons, squares, or have no enclosures, but they all maintain a unified visual language through line thickness and style.
The overall look of the slide is minimalistic and organized, with a contemporary and professional aesthetic. The consistent icon design and neatly arranged labels create a useful reference for viewers.
Use Cases
- To enhance visual communication in presentations related to energy, agriculture, or public services by incorporating relevant icons.
- As a visual aid in educational materials or training sessions for sectors such as healthcare, military, waste management, and media.
- For categorizing and organizing information in reports or informational documents that cover multiple sectors displayed on the slide.
- In marketing materials or proposals to represent services offered by a company in the various sectors like research, space, culture, or entertainment.