Your graphics add a nice touch to my presentations and I recently used them for one of my all-hands meetings. Your toolbox adds professionalism to my slides. Instead of using standard clipart.
Claude Jones, Director of Engineer, @Walmartlabs, USA
Your graphics add a nice touch to my presentations and I recently used them for one of my all-hands meetings. Your toolbox adds professionalism to my slides. Instead of using standard clipart.
Claude Jones, Director of Engineer, @Walmartlabs, USA
I needed a fresh look at some of my slides. I've tried to find a way to create a paintbrush effect, to underline, accentuate, add some color and the handwritten markers were just the things. Very easy to use, easy to size, change the color. It was an affordable, perfect solution and I'm happy to recommend it.
Anonymous, US
The crisp, clean look of the graphics, and the fact that it allowed me to easily edit and change the colors to match the template was my main reason for purchasing them.
Brandie Jenkins, E-learning Developer, USA
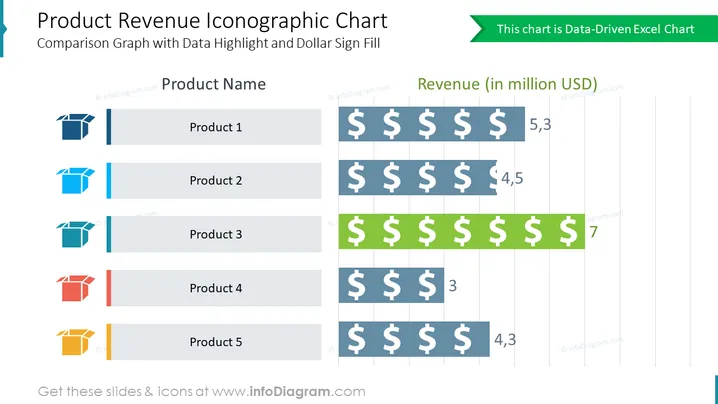
##Slide content:
This product revenue iconographic chart slide can help you present five main products and compare the revenue they bring. This can further help you to determine the USP and focus on it or take it as an example, and together with your team work on improving the rest of the products. All the graphics are editable so you can adjust them based on your company's needs, and edit colors and elements without losing the quality. We included detailed instructions on how to do it, in case you have no designing skills. You can download and convert the presentation into other software such as Google Slides and Keynote. Click on the picture to see more infographic comparison bar chart slides to enrich your presentation.
##Slide infographic description: Data-Driven Excel Chart, 3D Box Icons, Dollar Symbol, Text Blocks, Line Vectors


