Outline Style Icons Set – Lewin’s Change Model Symbols
Slide Content
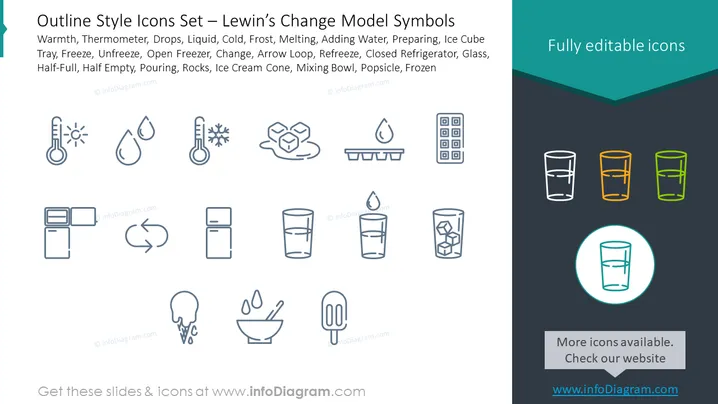
The slide presents a set of outline style icons representing various elements connected to Lewin's Change Model. The icons include representations for Warmth, Thermometer, Drops, Liquid, Cold, Frost, Melting, Adding Water, Preparing, Ice Cube Tray, Freeze, Unfreeze, Open Freezer, Change, Arrow Loop, Refreeze, Closed Refrigerator, Glass, Half-Full, Half Empty, Pouring, Rocks, Ice Cream Cone, Mixing Bowl, Popsicle, and Frozen. Each icon visually depicts a concept related to change and transition, such as temperature change (Warmth, Cold), state change (Freeze, Unfreeze), or progression stages (Adding Water, Preparing).
Graphical Look
- The slide has a clean, minimalist design with a dark teal header containing the slide title in white and a lighter teal subheader.
- A set of 20 outline icons is arrayed in four rows of five columns, with a good amount of white space surrounding each icon that helps to highlight them.
- Icons are uniformly styled with thin lines and open shapes to represent concepts clearly and simply.
- Five icons in the last row are color-highlighted: four glasses with different water levels and highlighting colors (gray, orange, blue, yellow), and one glass encircled, drawing attention to that particular icon.
- At the top right, there is a label saying "Fully editable icons" with a corner fold effect for added visual interest.
- The color scheme is cool and professional, with the dark teal, light teal, and accents of brighter colors for selected icons.
The slide's overall look is clean and professional, suitable for business or educational settings. The uniform outline style of the icons contributes to a coherent visual theme that is easy to interpret.
Use Cases
- To illustrate stages or elements of Lewin’s Change Model during change management training sessions.
- In presentations where organizational changes are discussed, providing visual metaphors for each step of the process.
- As part of educational materials to teach students about the theory of change and its applications in various fields such as business or psychology.
- To enhance consulting services proposals or reports that incorporate Lewin's Change Model, making the content more engaging with clear visuals.