Your graphics add a nice touch to my presentations and I recently used them for one of my all-hands meetings. Your toolbox adds professionalism to my slides. Instead of using standard clipart.
Claude Jones, Director of Engineer, @Walmartlabs, USA
Your graphics add a nice touch to my presentations and I recently used them for one of my all-hands meetings. Your toolbox adds professionalism to my slides. Instead of using standard clipart.
Claude Jones, Director of Engineer, @Walmartlabs, USA
I needed a fresh look at some of my slides. I've tried to find a way to create a paintbrush effect, to underline, accentuate, add some color and the handwritten markers were just the things. Very easy to use, easy to size, change the color. It was an affordable, perfect solution and I'm happy to recommend it.
Anonymous, US
The crisp, clean look of the graphics, and the fact that it allowed me to easily edit and change the colors to match the template was my main reason for purchasing them.
Brandie Jenkins, E-learning Developer, USA
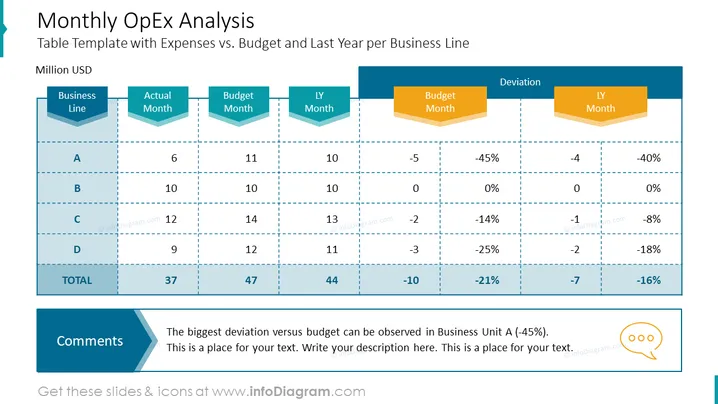
The slide presents a summary of Operational Expenses (OpEx) for four different business units, A through D, with a comparative analysis of the actual vs. budgeted expenses for the current month, as well as the performance relative to the same month in the previous year. It highlights deviations in percentage terms, which indicate over or underspending in proportion to the budget. The "Comments" section at the bottom suggests that the largest variance was observed in Business Unit A, inviting an explanatory text to be inserted.
The slide uses contrasting colors and icons to facilitate the comprehension of financial data. The overall design is clean, with a focus on readability and space for text, making it suitable for a corporate financial analysis presentation.


